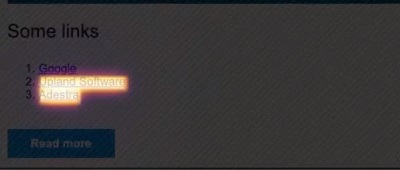
The heatmap report displays click activity within your email content, showing you which links were the most popular links within a campaign. This allows you to refine campaigns based on contact interaction.
To view a heatmap:
-
Open a campaign report.
-
Select the heatmap tab.
Note: heatmaps cannot be shown for launches older than your retention period or for campaigns where the message was deleted.
Viewing click activity
Note: the heatmap only shows clicks from the HTML part of your campaign and so may differ from other reporting figures.
By default, the heatmap overlays a preview of your current campaign with a colour-grading according to link activity. The brighter the overlay, the higher the activity for that link.

For campaigns with conditional content, use the show content for contact button to view variations of your campaign using the conditional content.
Note: this does not create a heatmap report for an individual contact.
If a link has had no clicks then it will not be highlighted within the heatmap.
Tip: change the opacity of the overlay using the slider in the heatmap pane.
To view statistics for each link, either:
-
Hover over the link to display a tooltip-style popup window with information on engagement type, engagement ranking, etc.
-
Select the links tab to view a ranked list of your links by engagement.
Tip: press a link's contact count to go to the data viewer and browse the contacts that clicked that link. You can also click the URL to navigate to the linked page.
Note: the statistics presented are an aggregate of clicks across all the launches in a group, e.g. if you select a group with three launches, your heatmap will include aggregated data from all three launches.
To view data specific to an individual launch, select that launch from the summary tab before viewing the heatmap.
Definitions of engagement type in the heatmap
- Clicked - the percentage of a campaigns total clicks generated from that individual link.
- Opened - the percentage of a campaigns total opens who went on to click that individual link.
- Delivered - the percentage of all campaigns delivered in which the recipient went on to click that individual link.
Note: your percentages may add up to more than 100% as each link displays a percentage specific to that link, representing how many contacts sent the campaign have clicked that link, and not a percentage of total clicks.
Example: for a campaign sent to 100 contacts where:
-
75 contacts clicked on link one, and
-
50 contacts clicked on link two,
The first link would display 75% (75 clicks out of 100 recipients) and not 60% (75 clicks for that link out of 125 total clicks).
The second link would display 50% (50 out of 100) and not 40% (50 out of 125).