Reading the Opportunity Progress Summary
Learning Objectives
After completing this unit, you’ll be able to:
- Explain the difference between the projected close date and the CRM (customer relationship management) Close Date
- Explain the measure of progress
- Describe what the timeline bar represents
- Explain what each of the icons represents
The summary panel on the opportunity plan's Process page gives Lynn and the team a quick way to see the current status of the opportunity.
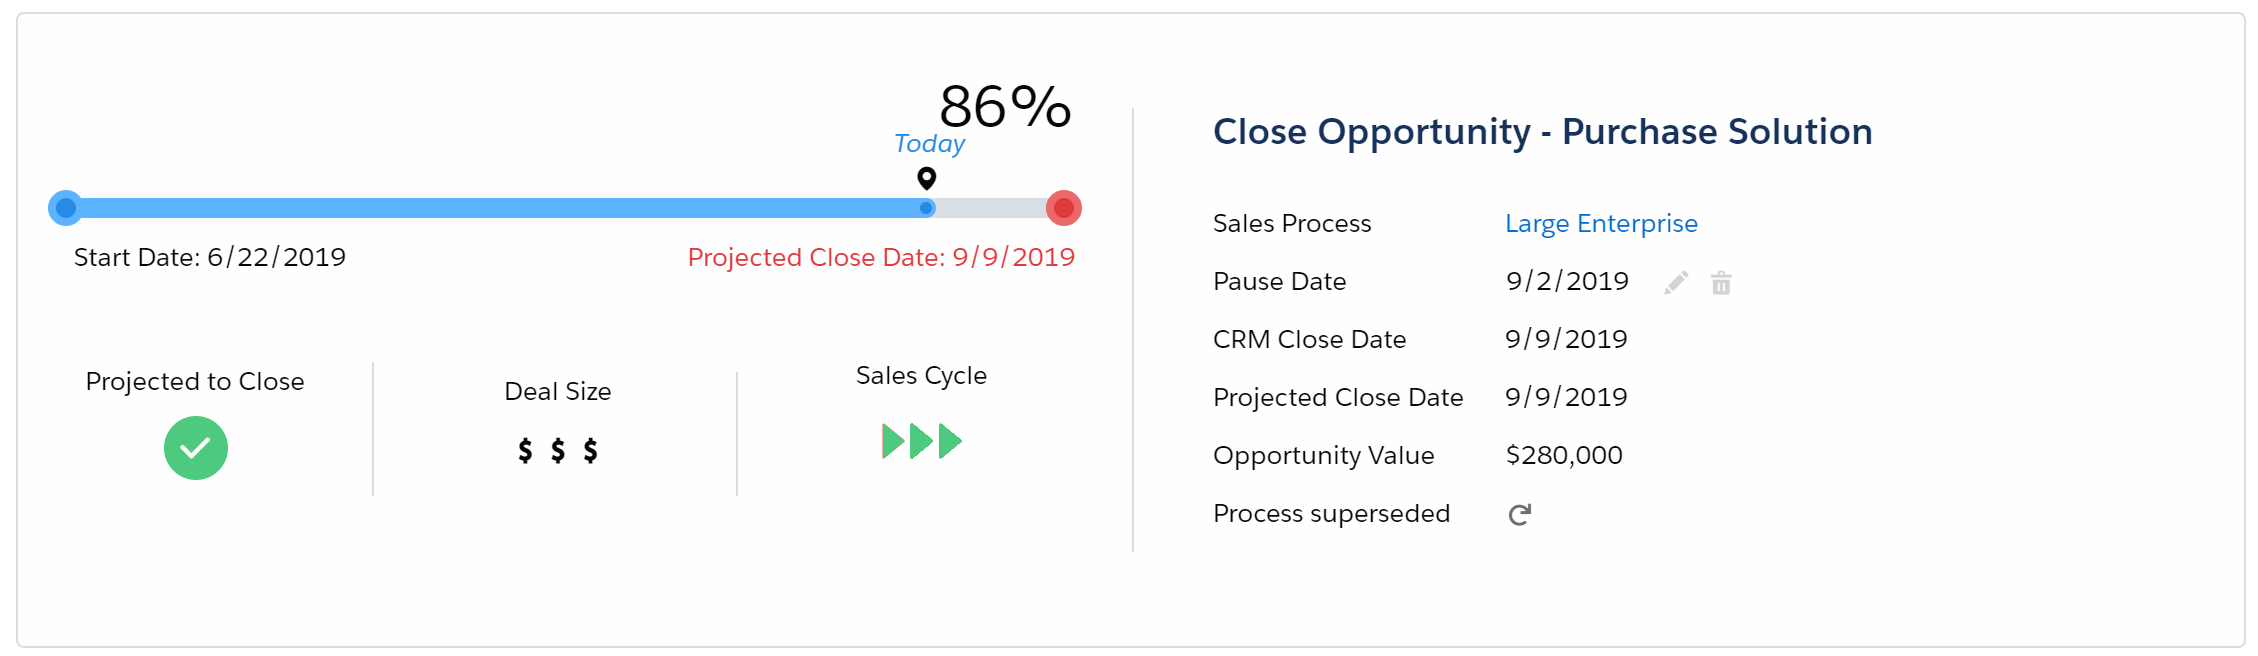
Projected Close Date versus CRM Close Date
The projected close date is calculated automatically by the software based on how long it should take Lynn and the team to complete the current and remaining stages of the sales process.
The CRM close date is the close date set manually for the opportunity in Salesforce.
The difference between these two dates, of any, is shown in red in the summary panel. However, in this example Lynn sees that the two dates are in agreement.
Measure of Progress
The measure of progress shows the percentage of the sales process Lynn and her team have completed.
Lynn sees that ithe software has calculated a measure of progress of 86 percent for the opportunity, based on the current answers to qualifying questions, compared to the best possible set of answers for the whole sales process.
(This calculation takes into account that some questions are more important to answer than others.)
Note: With the right configuration of qualifying questions and stages, the measure of progress can be a useful proxy for closure probability, because a positive answer to a qualifying question should represent a level of alignment with the customer.
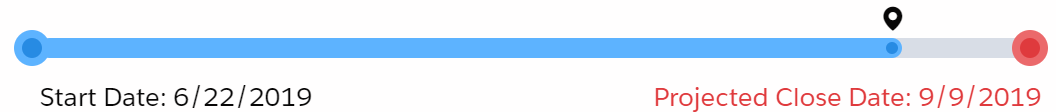
Timeline Bar
The timeline bar is a quick visual indication of how long the opportunity has been in progress, and when it's expected to close.
Projected to Close Icon
The projected-to-close icon may be either orange or green. Orange indicates that, based on Lynn's current answers, the opportunity is not expected to close. When the icon is green, it means that the answers now indicate that the opportunity is expected to close.

Deal Size Icon
The deal-size icon indicates the relative value of the opportunity: small ($), average($$), or large ($$$). These deal-size thresholds are set by the administrator for each sales process.

Sales Cycle Icon
Based on how long it took Lynn to progress through previous stages of the sales process, the sales-cycle icon gives a visual indication of whether the opportunity is behind schedule, on schedule, or ahead of schedule. The software bases this on the durations set by the administrator for this sales process.

Try It Yourself
In the previous unit, we suggested that you update qualifying questions belonging to an active opportunity's sales process. The summary panel shows you the current state of that opportunity. You can check the:
- Projected close date
- CRM close date
- Measure of progress
- Timeline bar
- Projected-to-close, deal-size, and sales-cycle icons