Configure Analytics for SmartHub with SharePoint 2013/16/19/SPSE
- Overview
- Initialize Kibana
- Configure the Analytics Component
- Verify Kibana Configuration
- How to Access the Reporting Site
- Analytics Settings
Overview
To configure Analytics for SmartHub you perform the following:
- Install all necessary third-party applications
- Configure the Analytics Component
-
Configure and access the Reporting Site
-
Verify the Analytics Components
Initialize Kibana
Use the following steps to initialize Kibana v7.x:
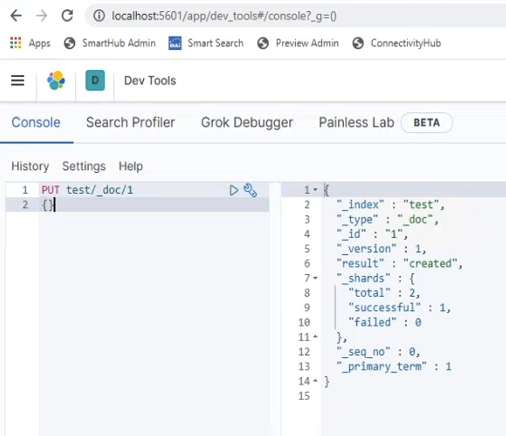
- Go to your Kibana Dev Tools.

- URL (or similar): http://localhost:5601/app/dev_tools#/console?_g=()
- Enter this command and run it:
PUT test/_doc/1
{}
- Open Stack Management → Index Patterns:

- URL: http://localhost:5601/app/management/kibana/indexPatterns
- Create an index pattern based on index:
- Click "Create Index pattern."
- Write "test" in "index pattern" text box. NOTE: The field is case-sensitive!
- Click the Next step button.
- Click "Create index pattern"
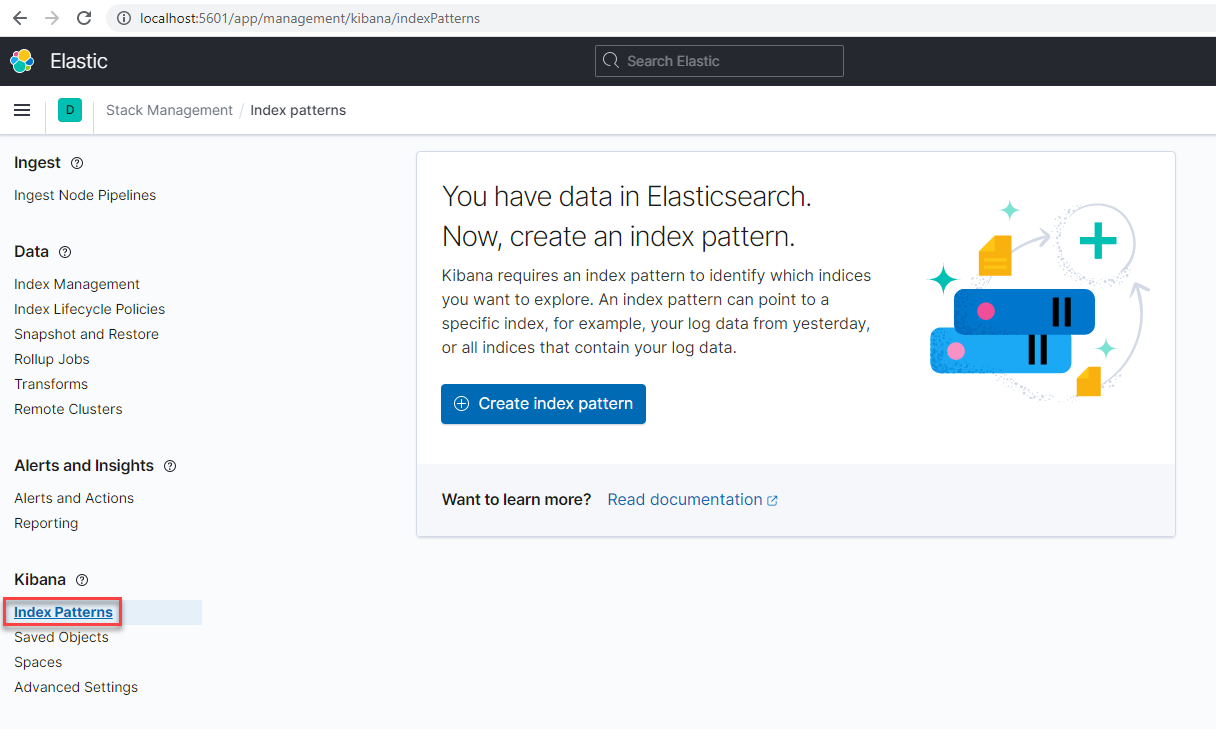
After you totally complete the SmartHub Analytics installation, you can delete the index-pattern and index.
- Go to Kibana address → Stack Management → Index Pattern.
- Delete the "
test"index pattern.
- Delete the "
- Go to Kibana address → Dev Tools.
- Enter into the console "
DELETE test"to delete index.
Configure the Analytics Component
To configure Analytics, use the following steps:
- Navigate to the SmartHub Administration page by going to http(s)://[SmartHub-web-app-url]/_admin
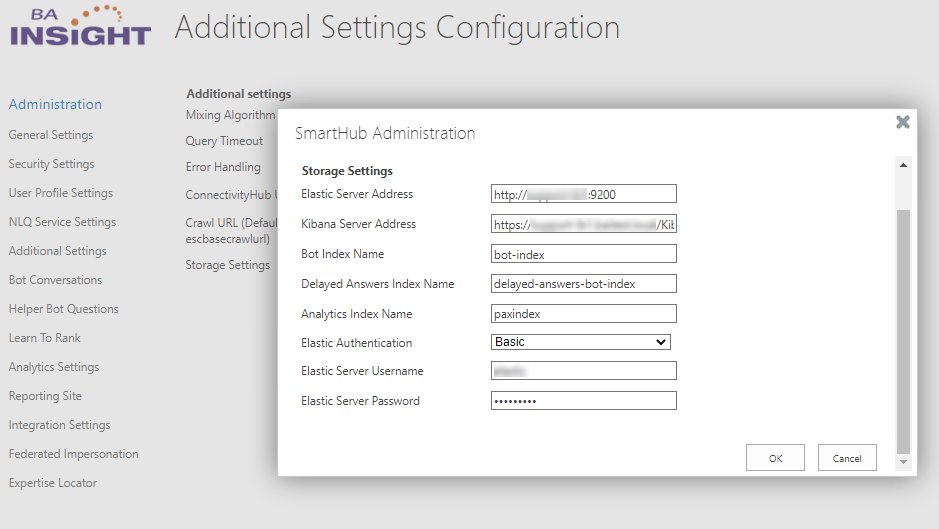
- Go to the Additional settings page and click on Storage Settings > Edit.
- Complete all the fields shown.
Some information is pre-populated.
See the graphic below.- Elastic Server Address: URL, including port number, of your Elasticsearch server
- Kibana Server Address: URL, including port number, of your Kibana server. For example: http://myhost:5601
- Bot Index Name: Name of your bot index. Default name is bot-index.
- Delayed Answers Index Name: Name of your delayed answers index.
- Analytics Index Name. Save the changes.
- Authentication mode:
- Basic:
- Account: Necessary only for Elastic users. Username of the account used to access your Elasticsearch server.
- Password: Necessary only for Elastic password. Password of the account used to access your Elasticsearch server.
- Token Based:
- Azure App ID: Enter App IDs from Azure App created for Elastic Authentication
- Azure Secret Key: Enter Secret Key from Azure App created for Elastic Authentication
Azure Scope: Enter Azure Scope from Azure App created for Elastic Authentication
Optional
The Kibana Server address (configured at step 3-b. above) is used when displaying reports to end users.
- Typically, you provide your Kibana Service Address here, however that address may not be accessible to end users.
- If the Kibana address domain or HTTP settings are different from SmartHub, you may have difficulty displaying the reports in the browser.
As a solution, you may wish to configure Kibana behind a reverse proxy; to do so, see the FAQ "How Do I Configure the Kibana URL for Reporting Behind a Reverse Proxy?"
Optional
When using Kibana and Elastic Cloud, you have to add the following setting to the file kibana.yml xpack.security.sameSiteCookies: "None"
Take a look at Embedded content authentication for more information.
- Basic:
- Scroll down and click Save to save your changes.
Advanced Settings
- Click "Analytics Settings" from the left-side navigation list.
- The Analytics Configuration page opens.
Recommended Results Configuration JSON
-
You can leave this field as it is (default).
-
This field can be customized at any time.
Query Suggestion Settings Configuration JSON
-
You can leave this field as it is (default).
-
This field can be customized at any time.
Verify Kibana Configuration
- Kibana Configuration Status:
- When you access the page, you will see a message which describes the Kibana configuration status:
- "Kibana is not configured" → This means that the Kibana objects are not imported, and the mappings of the Analytics index are not created.
- The configuration of Kibana is performed upon clicking the "Save Configuration" button.
- "Kibana already configured" → This means that the Kibana objects have already been imported and the Analytics Index mappings have already been created.
- "Kibana is not configured" → This means that the Kibana objects are not imported, and the mappings of the Analytics index are not created.
- When you access the page, you will see a message which describes the Kibana configuration status:
How to Access the Reporting Site
To access the Reporting Site, use the following steps:
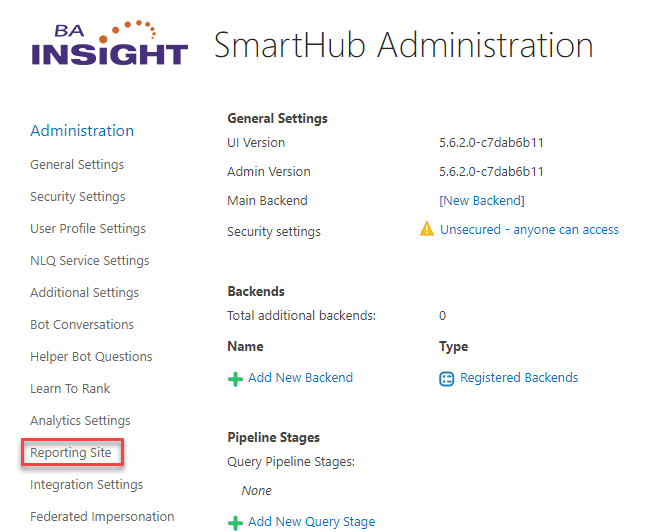
- Navigate to the SmartHub Administration page by going to the SmartHub Admin web User interface (UI) or enter the URL in the format: http(s)://[web-app-url]/_admin
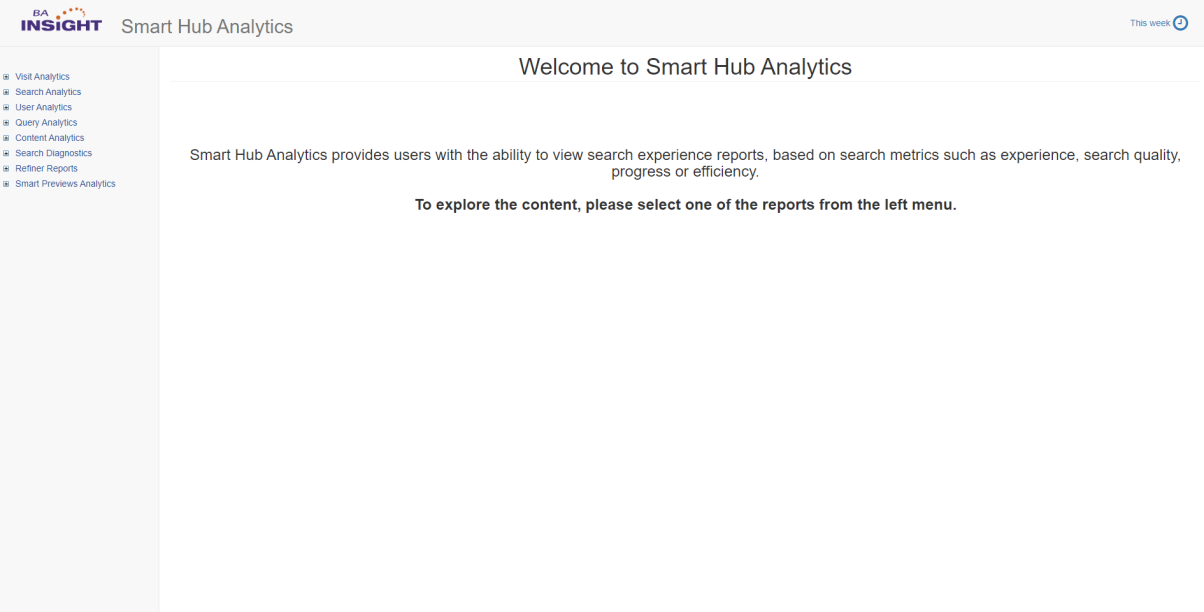
- Click Reporting Site as shown in the graphic here:
- The SmartHub Analytics reporting site appears:
Analytics Settings
| Setting name | Default value | Description | |
|---|---|---|---|
| Enabled | "true" |
|
|
| PAXModules | PAXModules "PAX_PortalModule,PAX_SearchModule,PAX_UserProfileModule, PAX_VisualRefinersModule,PAX_SmartPreviewsModule,PAX_Ratings, PAX_ChatBotModule,PAX_SmartAutomationsModule" | The modules for which actions are recorded in the analytics index. | |
| customProperties | "" |
|
|
| showTrackingBehaviorControl | "true" |
|
|
| enableGeolocationTracking | "true" |
|
|
| artifactPushInterval | 60 |
The number of seconds after which the actions will be sent to the server to be recorded in the analytics index. Note: In order for actions to be recorded in real time set this setting to 0 seconds.
|
|
| visitsDuration | 30 | The number of minutes after which a visit ends. | |
| geolocationTrackingMessage | "We would like to know your location in order to improve your search experience.".toLocaleString() | The message displayed for geolocation tracking. | |
| trackingBehaviorPropertyName | "BAISmartHubAnalyticsTrackingBehavior" | The property name for tracking behavior. | |
| defaultTrackingBehavior | "0" |
|
|
| trackingControlFile | "client/pax-tracking-behavior-control" |
The path to the trackingControl JavaScript file. Note: Must have the format used by require.js
|
|
| recommendedResultsControl | showRecommendedResultsDropdown | false |
|
| enableRecommendedResultsControl | true |
|
|
| title | "Filter results by".toLocaleString() | The label of the recommended results dropdown list | |
| messageNotFoundRecommededResults | "Could not find any results for option: ".toLocaleString() | The message displayed when no results are found for recommended results | |
| items |
Copy
|
|
|
| parentSelector | ".coveo-results-header" | The JQuery selector for parent element(s) where to inject the control. | |
| UserProfileMappings |
Copy
|
|
|
| enableCaseSensitivity | "false" |
|
|
| logLevel | "WARN" |
|
|
How to Modify the Analytics Settings
To modify the Analytics settings, you need to access two files listed below.
- Your Index or Results page custom settings file (.js):
- Located in <SmartHub_root_folder>/CustomerCustomization/settings
- If you want analytics to track data on your Index page, use your custom Index settings file: IndexCopySettingsCustomSettings.js.
- If you want analytics to track data on your (search) Results page, use your custom Results settings file: ResultsCopyCustomSettings.js. This is the natural choice.
- If you have a separate custom settings file see How to Customize Your SmartHub User Interface.
- Analytics settings: The file DefaultModuleSettings.js contains all SmartHub analytics properties, which control how analytics behaves on your web page.
- The DefaultModuleSettings.js file is stored in: <SmartHub_root_folder>/modules/SmartHubResourceLoader.
Example: Disable Geographical Location Tracking
In the following procedure you disable Geographical location tracking.
To do this, you copy the Geographical location tracking code from DefaultModuleSettings.js file into your custom settings file and change the value from true to false to disable the function.
- Open the file DefaultModuleSettings.js, shown below.
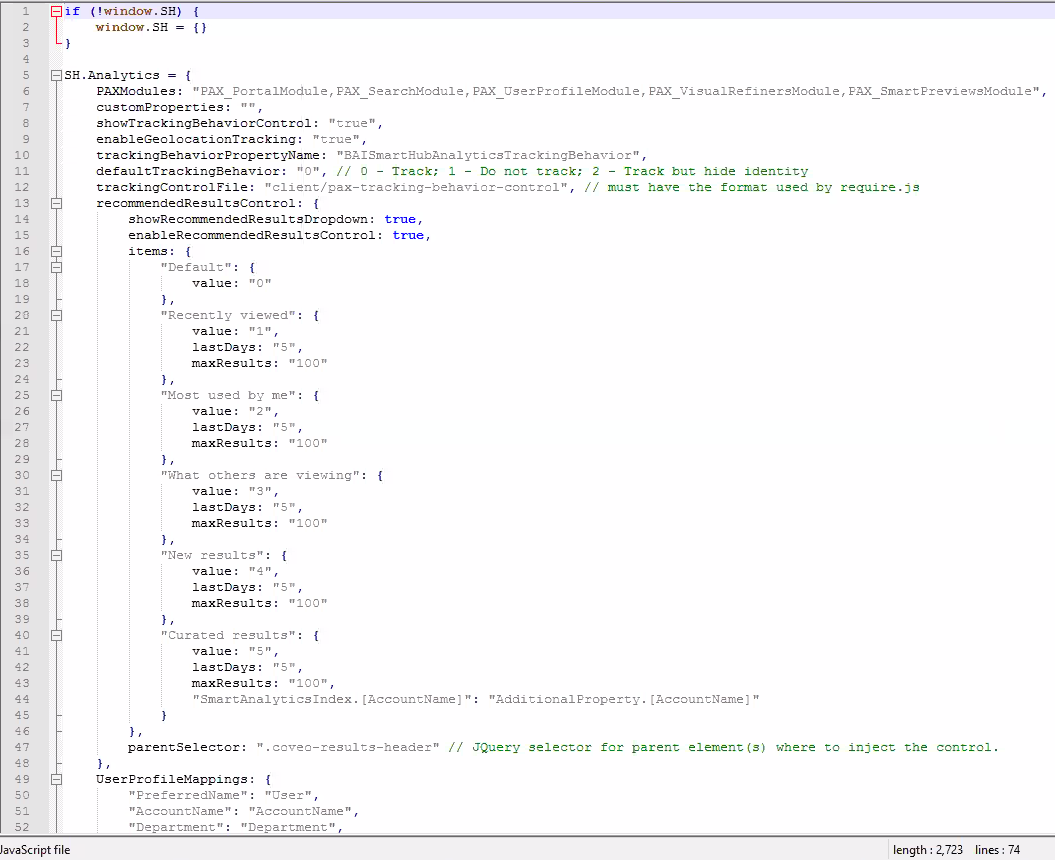
- Copy the setting
enableGeolocationTracking: "true".
Note that you can copy and modify any setting you desire. - Open your custom Results settings file and paste the setting under the SH.AnalyticsSettings.CustomSettings block.
- Change the value to "
false." - In the example below, the custom setting is added to disable the Geological Tracking option.

- Change the value to "
- Save the file.
- Ensure your custom setting file is referenced by the custom Index or Results HTML pages where you want analytics to track your data.
- In the graphic below, the custom Index page IndexCopy.html references the custom settings file IndexCopyCustomSettings.js.
For more information, see How to Instruct SmartHub to Load your Custom Settings.
- In the graphic below, the custom Index page IndexCopy.html references the custom settings file IndexCopyCustomSettings.js.