Building Reports in "NextGen" Upland Analytics
Beginning in January 2022, Upland Analytics started to get a newly-refurbished look and feel. This new "NextGen" design makes it easier for users to find and organize the reports, graphs/charts, and dashboards that help them monitor trends, identify gaps, and make strategic decisions.
"NextGen" will soon become the default version of Upland Analytics, so it is highly recommended that users accustom themselves to the new interface.
To access this new version of Upland Analytics, select the Try New Analytics button in the top right-hand side of the Upland Analytics screen:
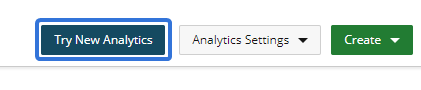
Note: The previous version of Upland Analytics is now known as Analytics Classic. It can be accessed at any time by selecting Back to Analytics Classic in the top right-hand corner of the "NextGen" screen:
This page will familiarize you with building reports in "NextGen" Upland Anlaytics before it becomes a permanent part of Eclipse PPM.
Tip: For additional help with "NextGen" Upland Analytics, select the Help  or Tutorial
  icons from the Analytics Menu. Also, see the New Analytics Help Center for more information.
To build a report in "NextGen" Upland Analytics:
Before You Start: Eclipse PPM users require the "Modify - Upland Analytics" permission from an Application Policy to create reports in Upland Analytics.
-
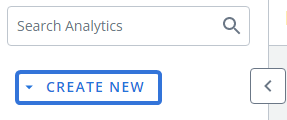
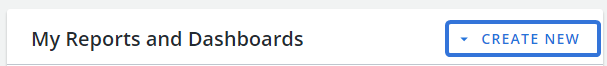
Select the Create New drop-down menu from either the Analytics Menu or the "My Reports and Dashboards" table:
-
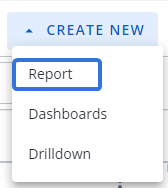
Select Report from the drop-down menu:
-
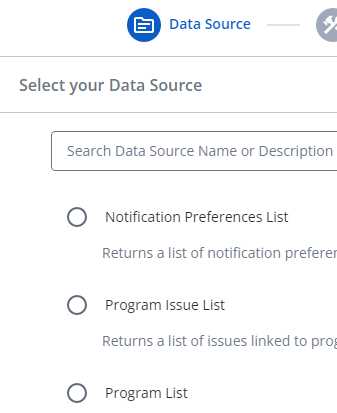
Select a Data Source from the list:
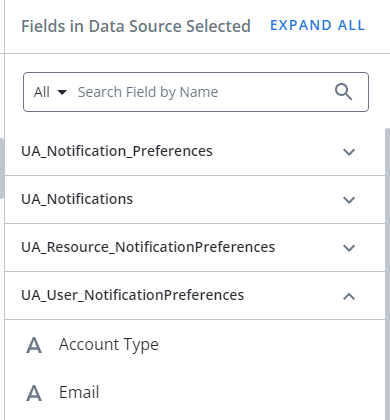
Tip: After selecting a Data Source, the Data Views that belong to it will be previewed in the "Fields in Data Source Selected" panel on the right-hand side. Expand any of the views to see which fields are available:
-
Select the Next button in the bottom right-hand corner:

-
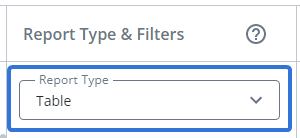
Select a Report Type from the "Report Type" drop-down menu in the middle panel:
Note: Click here for more information on Upland Analytics Report Types.
-
Expand the Data View that contains the field(s) you would like to include in your report:

Click thumbnail to play.
Tip: Use the search bar to find certain fields if you are unsure which Data View they belong to. Alternatively, see Data Sources and Views for lists of each Data Source and their related views and fields.
-
Use the six dots
 to drag and drop the fields that you would like to use in your report from the "Available Fields" section to the "Columns" bucket on the right:
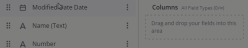
Click thumbnail to play.
Tip: Hold the Shift key on your keyboard and select multiple fields to drag them all over at once:

Click thumbnail to play.Tip: Instead of dragging and dropping, fields can be moved to buckets by selecting the three dots on the right-hand side of the field:
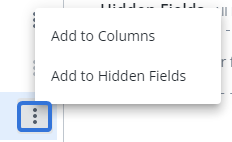
Note: To use an existing custom field, click the Custom Fields drop-down menu and drag and drop an existing custom field to the bucket on the right:
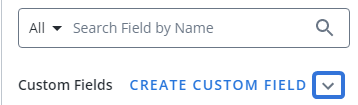
To use a new custom field, click Create Custom Field. See Create a Custom Field from the Upland Analytics Help Center for more info.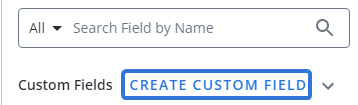
-
Repeat Steps 6-7 until all of your desired fields are in the "Columns" bucket.
-
(Optional) Drag and drop any number of fields from the "Available Fields" section into the "Hidden Fields" bucket.
Note: "Hidden Fields" serve as placeholder fields that can be pulled into the report on an on-need basis. They will not be visible in the report right away.
Note: When the report type is changed and the new report type does not use all the selected fields, Upland Analytics places the fields that make sense in the corresponding buckets, and the ones that don't are placed in the "Hidden Fields" bucket. This way, the selected fields are saved.
-
(Optional) Select the Preview button to see what the report would look like upon running immediately.
-
(Optional) Select the Filter icon
 on any of your chosen fields to filter the report by certain values:
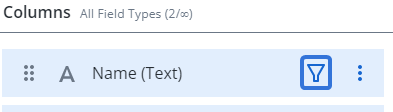
Note: Two types of filters can be added to a field: Basic and Advanced.
Basic: These filters are based on keywords. If the value for the field contains the keyword exactly as it is typed, the item will be included in the report. For example, this filter will only include Projects that have the word "Digital" in the name: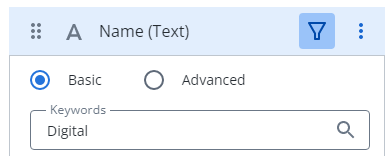
Advanced: Multiple conditions can be added to these filters through the drop-down menus. For example, a condition can be added to include the word "Digital" in the Project name, same as above:
On top of this, another condition can be added to prevent Projects with "Architecture" in the name from appearing in the report: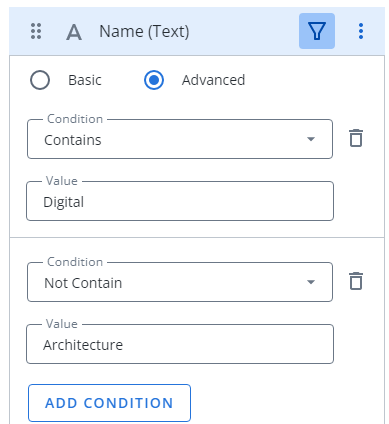
For more information on field filters, see Apply a Filter to a Field in the Upland Analytics help center. -
Select Set Permissions & Save to finish the report:
OR
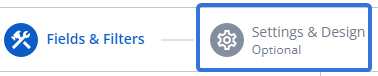
Select Settings & Design from the top of the screen to apply some settings to your report before saving:
Note: If you select Settings & Design, continue on. If you select Set Permissions & Save, skip to step 18.
-
Adjust the settings of your report using the left-hand panel:
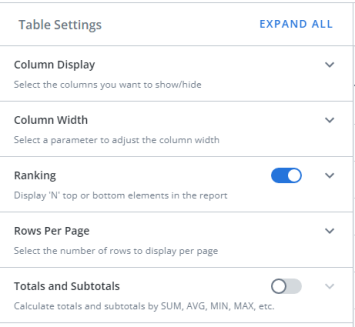
Note: The available settings will depend on the Report Type you originally chose. See Report Settings in the Upland Analytics help center for more information on settings by Report Type.
-
Select Set Permissions & Save to finish the report:
OR
Select Report View Filters from the top of the screen to apply some fields that viewers can use as filters while viewing your report:
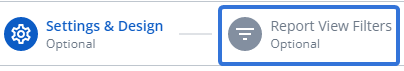
Note: If you wish to select Report View Filters, continue on. If you select Set Permissions & Save, skip to step 18.
-
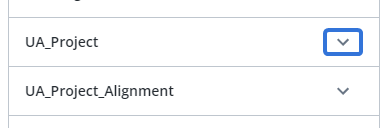
Expand the Data View that contains the field(s) you would like to apply as available filters:
-
Select the checkbox(es) of up to three fields:
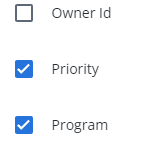
Tip: You can view the fields in the "Filters Selected" panel to the right:
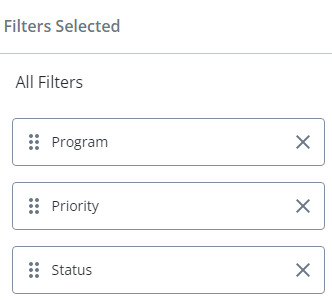
From here, you can drag and drop them by the six dots to rearrange them or select the "X" to remove them. -
Select Set Permissions & Save:
-
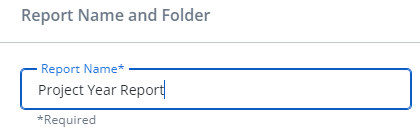
Enter a name for your new report:
-
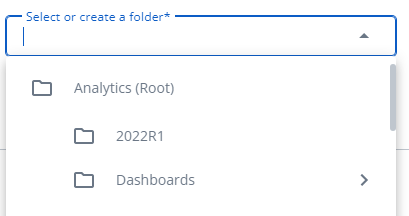
Select which folder the new report should be saved in:
OR
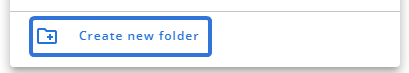
Select Create new folder from the bottom of the drop-down menu to create a new folder for the report:
-
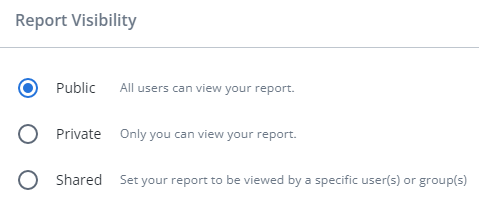
Select a visibility setting for your new report:
-
Public: All users can view your report in Upland Analytics.
-
Private: You are the only user who will be able to access and view the report.
-
Shared: Select specific users and/or groups that will have access to the report:
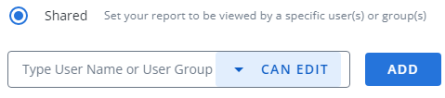
After entering the names of users and/or groups, use the drop-down menu to the right to determine whether they can edit the report or just view it:
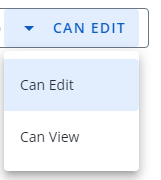
Select the Add button to apply the permissions. If desired, repeat the process to add in more users and/or groups.
-
-
Select the Save button to finalize the report:
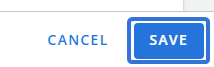
After clicking Save, your new report will be saved in Upland Analytics. For options on viewing your report, see Navigating "NextGen" Upland Analytics.