Business intelligence widgets
Administrators can create custom business intelligence data sources that allow you to pull specific information into widgets on your Workspace. The type of business intelligence widget you choose determines the format in which information returned for the data source appears on your Workspace.
BI data sources must be added prior to configuring a business intelligence widget on the Workspace. See BIDataSources for more information.
Note: This feature is only available for Enterprise and Workflow licenses. See FileBound licensing for more information.
Example: For the widget examples shown below, a business intelligence data source has already been created by an Administrator that will pull all files for the General Management department with an active workflow status.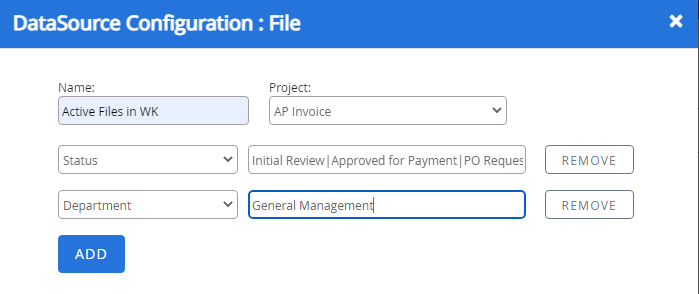
The following business intelligence widgets are available in FileBound:
BI/BarChart
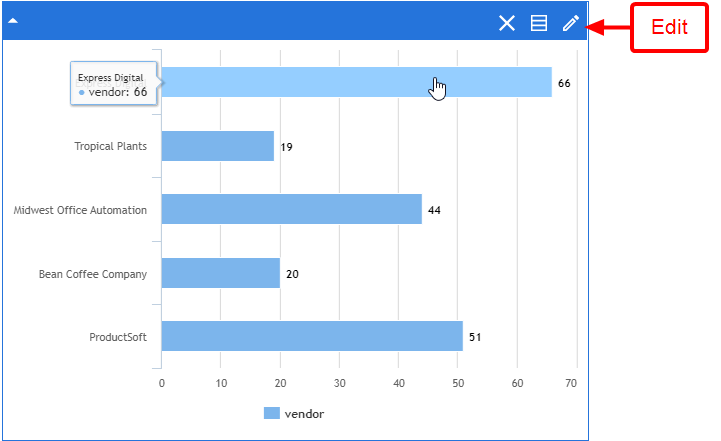
The information in a BI/BarChart widget is displayed as a bar chart. Each bar on the chart displays the number of items in the 'Group By' selection that the bar represents. You can click a bar to perform a search that returns only items from that particular bar in the data set.
You can modify the widget color, widget title, chart title, data source, 'Group By' selection, and operation by clicking Edit on the title bar.
Example: We have selected Vendor as our 'Group By' option, so this widget is displaying all files for the General Management department with an active workflow status, grouped by vendor.
BI/ColumnChart
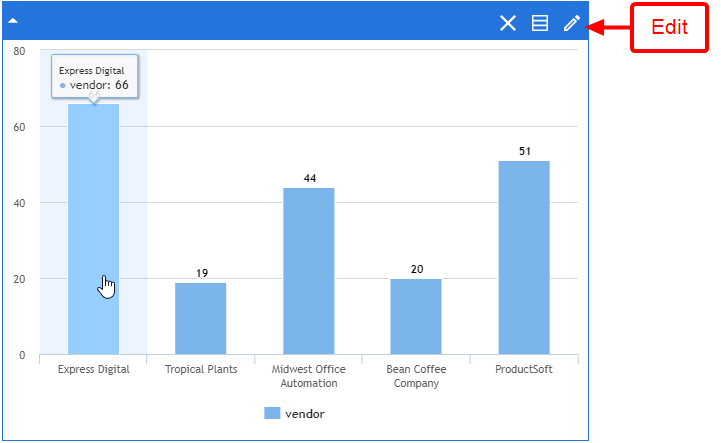
The information in a BI/ColumnChart widget is displayed as a column chart. Each column on the chart displays the number of items in the 'Group By' selection that the column represents. You can click a column to perform a search that returns only items from that particular column in the data set.
You can modify the widget color, widget title, chart title, data source, 'Group By' selection, and operation by clicking Edit on the title bar.
Example: We have selected Vendor as our 'Group By' option, so this widget is displaying all files for the General Management department with an active workflow status, grouped by vendor.
BI/FileGrid
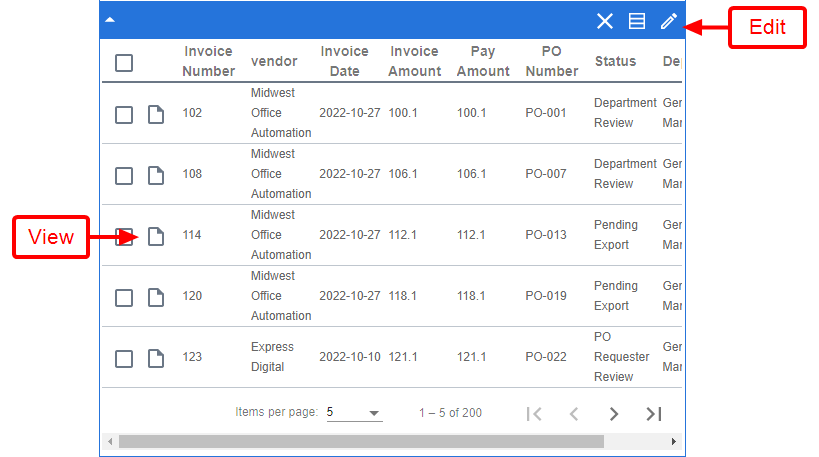
The BI/FileGrid widget displays a list of files returned for the selected data source. Click View to open a file in a viewer.
You can modify the widget color, widget title, and data source by clicking Edit on the title bar.
BI/PieChart
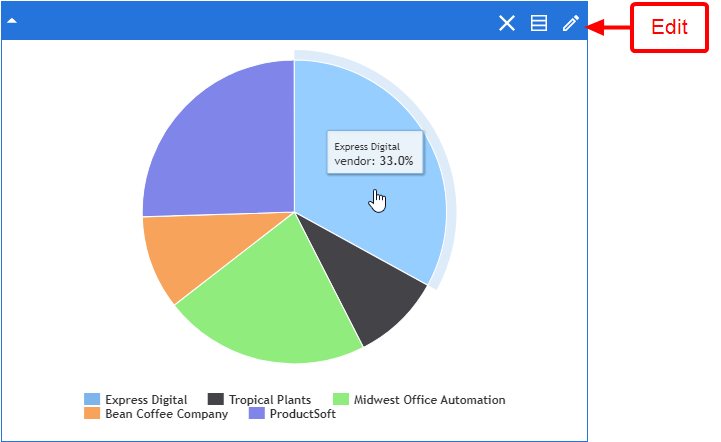
The information in a BI/PieChart widget is displayed as a pie chart. Each section of the chart represents your 'Group By' selection in the widget configuration. You can move the mouse pointer over a section in the chart to display the percentage of items that the section represents.
You can modify the widget color, widget title, chart title, data source, 'Group By' selection, and operation by clicking Edit on the title bar.
Example: We have selected Vendor as our 'Group By' option, so this widget is displaying all files for the General Management department with an active workflow status, grouped by vendor.
