Add a New Chart From a Measure
1. Click Charts
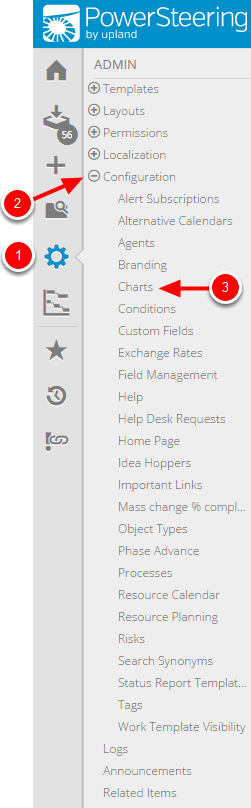
- On the Icon Bar click the Admin button.
- Click Configuration to expand the menu, then click Charts.
2. Click Add New
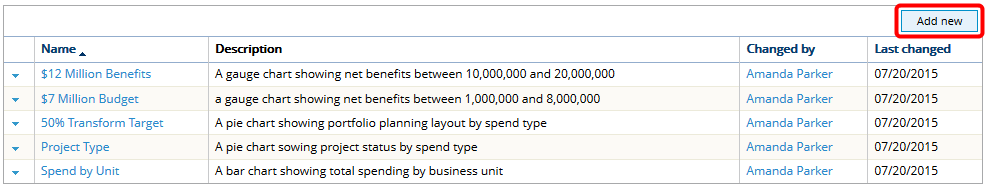
- Click Add new.
3. Enter Chart Details
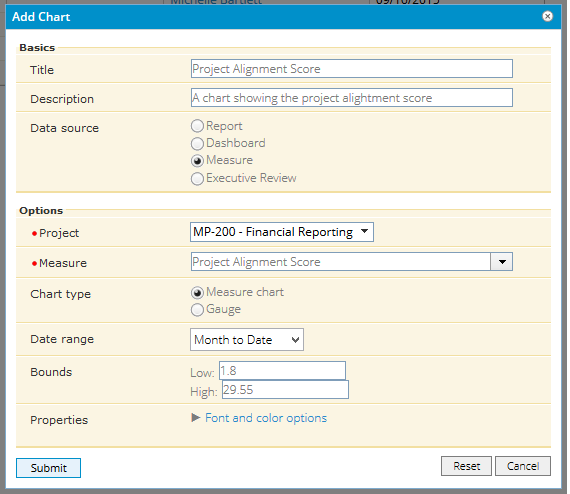
- Enter a title for the chart.
- Enter a description for the chart.
- Select Measure as the Data source.
- Locate the project where the measure exists.
- Select a measure from the context sensitive drop-down menu.
- Specify chart options to set up your chart.
- Click Submit.
Title: A title for the chart. The title is displayed at the top of the chart.
Description: Text that describes the chart's purpose.
Data source: Select a data source to define where your chart will derive data from.
Project: Select a project where the measure exists.
Measure: Select a measure to use as the data source for your chart.
3.1 Measure Chart Options
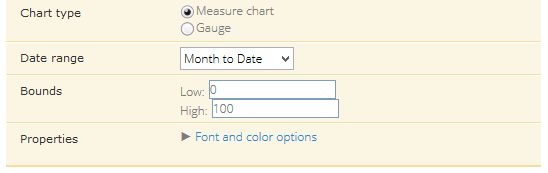
- Date Range: The date range to display in the chart.
- Bounds: Specify the low and high bounds. These define the values that are displayed on the Y axis of the chart.
Gauge: Select this option to display measure information in a gauge chart.
- Half gauge: The gauge chart will be a half-circle.
- Full gauge: The gauge chart will be a full circle.
4. View Chart
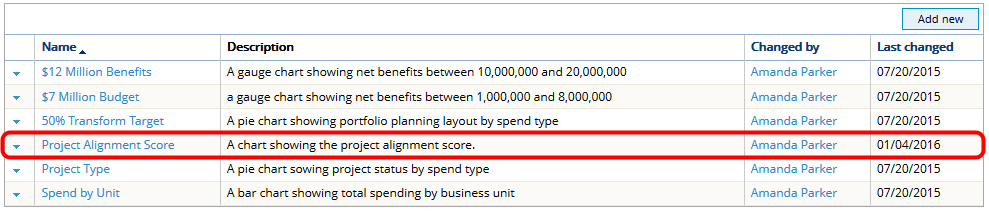
- View newly created chart in the charts list. Once a chart has been created here, it can be added to a new or existing Dashboard layout. See Add a New Dashboard Layout for more information.
5. View Chart
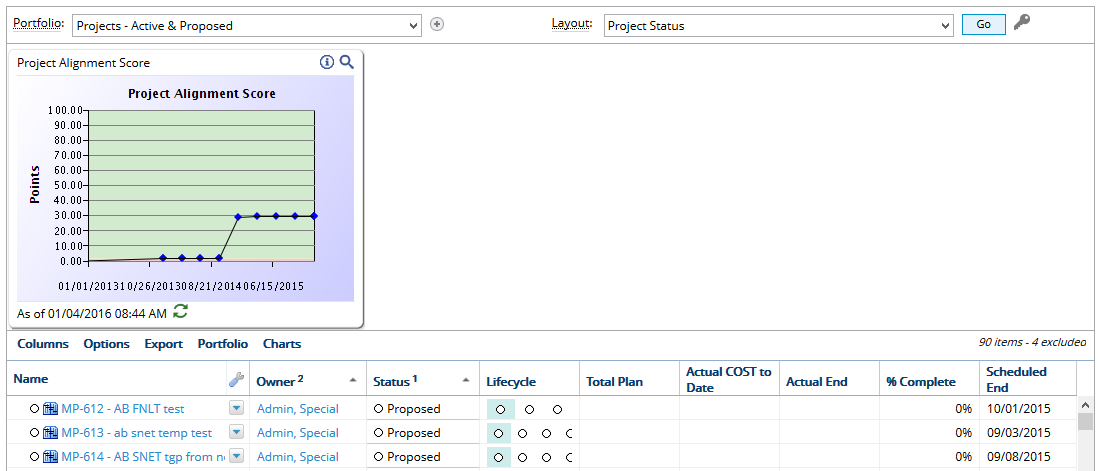
- View newly created chart on the Dashboard.