Workload Overview
The Workload page displays a bird's eye view of a Resource's work obligations over a 12 week or 12 month period. A user can access their own Workload under the Profile Menu or (if given the "View Load" User permission) view the Workloads of other users from their profiles.

The Workload page is split into two sections:
Cumulative Workload by Period
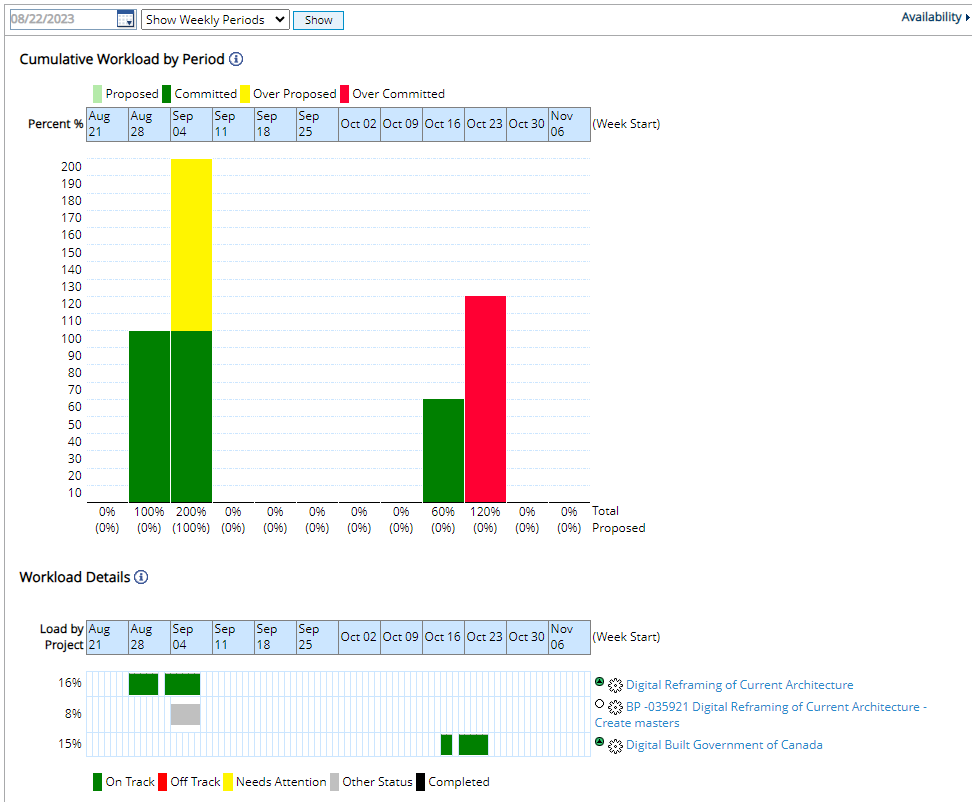
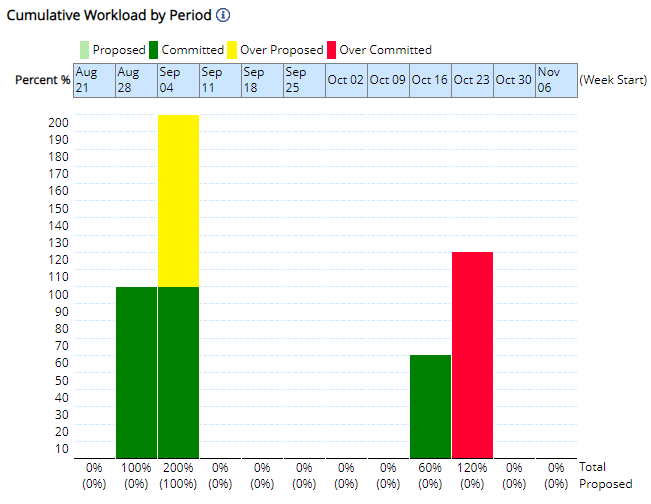
The bar graph at the top of the page is the "Cumulative Workload By Period" chart. It displays the total percent of allocated work by each time period:

The time covered by the graph (when it starts and whether weekly or monthly periods are used) can be determined by the fields at the top of the screen:

Note: The first period displayed will be the period that the selected date belongs to. The rest will be the 11 weeks or months that follow it.
Note: "Allocated work" is work that has been assigned to the Resource in PowerSteering.
The different bar colors represent the status of the work that the Resource is assigned to and whether or not the user has been allocated over their availability:

Note: "Proposed" refers to work items with a "Proposed" status. "Committed" refers to work items with any status that is not "Proposed".
Note: The Y-values on the graphs will illustrate in sets of 10%. For example, a value of 1% will result in the graph showing 0% - 10% shaded.
Workload Details
The graph at the bottom of the page is the "Workload Details" graph:

This graph indicates which work items are contributing to the Resource's Workload over the next 12 weeks or months. The time covered by the graph (when it starts and whether weekly or monthly periods are used) can be determined by the fields at the top of the screen:

Note: The first period displayed will be the period that the selected date belongs to. The rest will be the 11 weeks or months that follow it.
In the example above, the Resource's Workload comprises of work on three work items:

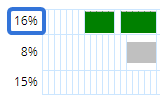
The percentage values on the left-hand side of the graph indicate how much of the Resource's Workload is attributed to the Work Item over the next 12 periods. For example, the "Digital Reframing of Current Architecture" Action Item at the top will take up 16% of this Resource's Workload:

The bars in the graph represent the time (days for weekly view, weeks for monthly view) that the Resource will spend/has spent on the work. For example, take a look at this chart that uses a monthly view:

Each month has four sections under it that represent four weeks. As you can see, the Resource has work scheduled for the last three weeks of March on both listed work items.
Note: As long as the work is scheduled on at least one day of the week, it will be included.
Note: In a weekly view, each period will contain seven sections representing the seven days of the week.
Finally, the colors of the bar indicate the current status of the work item. The legend below the chart signifies what each color means:
