Group Items on the Dashboard
When you are viewing a dashboard it is sometimes easier to group information by a particular tag or category such as status. When the data is grouped you have the option of expanding or collapsing each group of data to see the details or the summary level information. There is also menu items available under Options that let you expand or collapse all groups at once. You can also clear the grouping through the Options menu. See Dashboard Options Menu for more information on these features.
1. Click Dashboard
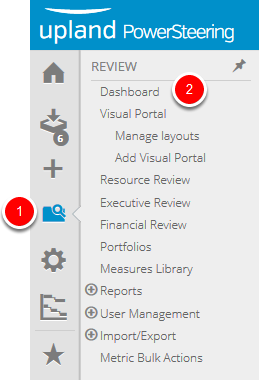
- On the Icon Bar click the Review button, then click Dashboard.
2. Select Column for Group
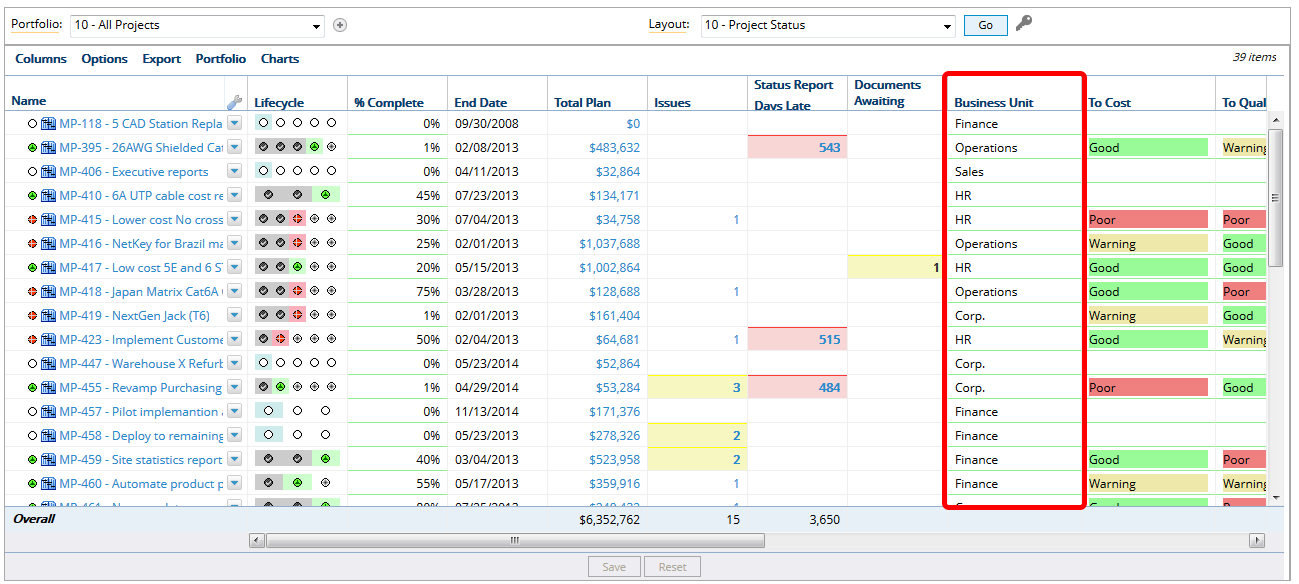
- Locate the column that you want to use to group your dashboard.
Note: When programs are part of a portfolio, grouping is only an option when you have replaced programs by their projects and are looking at a flat view. To replace programs with by projects, click the Programs menu, and select Replace programs by their projects.
3. Click Arrow
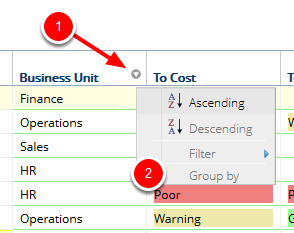
- Hover over the name of the column that you want to group by until the context sensitive drop down arrow appears.
- Click the context sensitive drop down arrow, select Group by.
Note: The Group by function is not available if the Program display option is set to Display Program Hierarchies. To enable the function, change the display option to any other option. For more information on this setting, see Program Console Programs Menu .
4. View Grouped Results
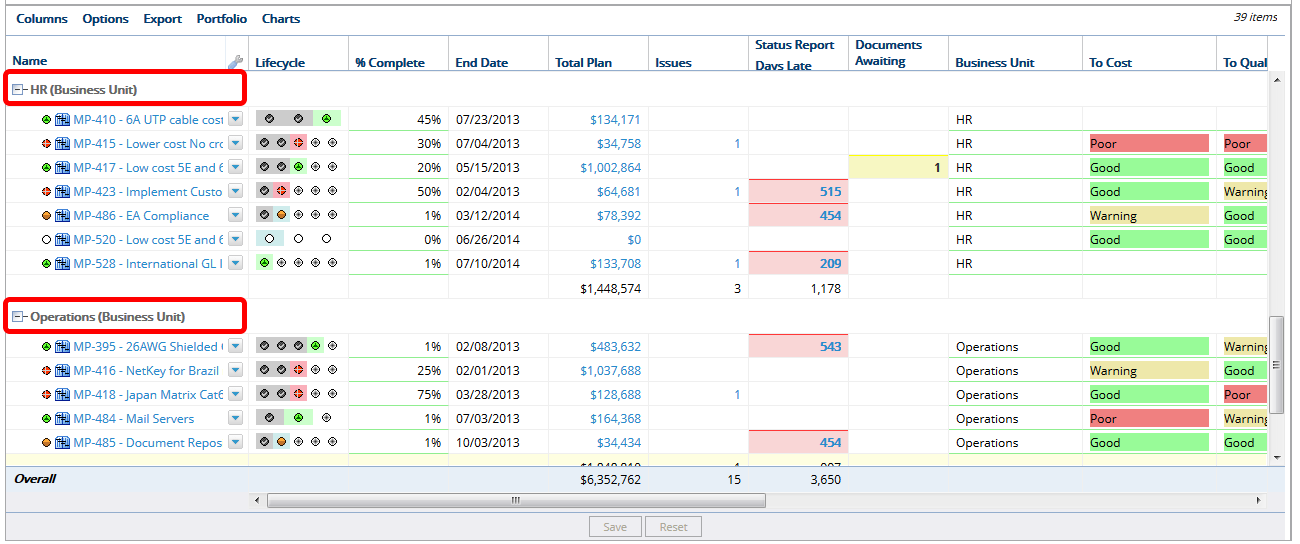
- View the grouped data on the dashboard.
5. Collapse / Expand Groups
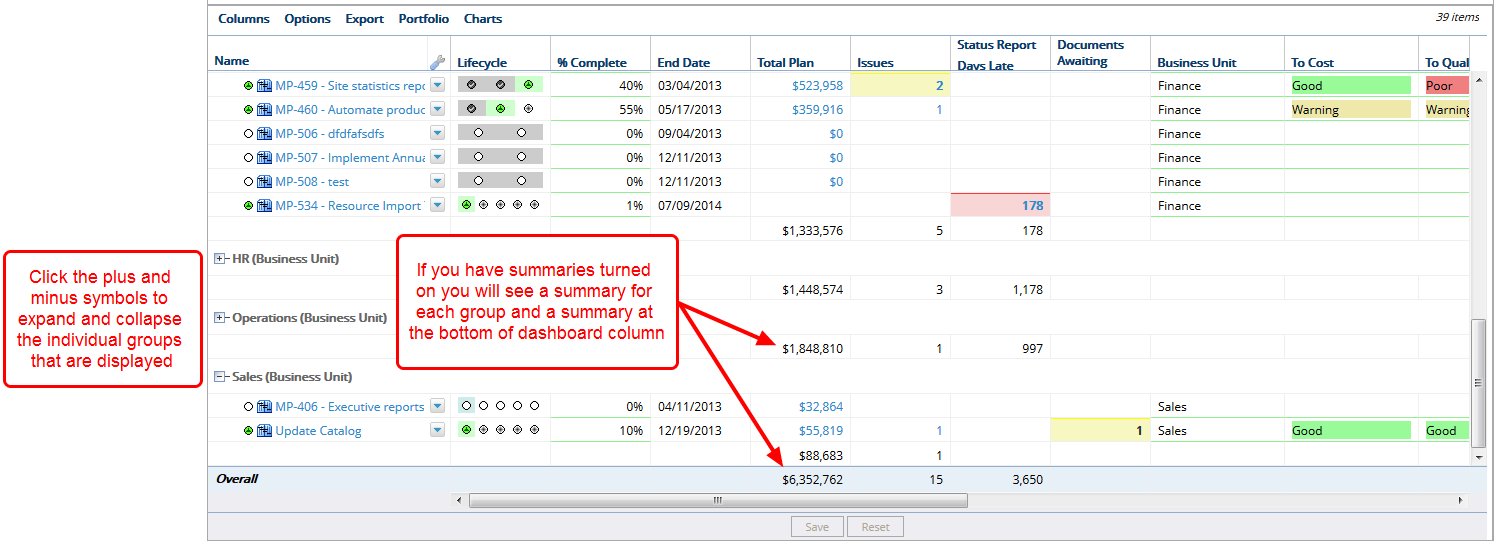
- Click the plus and minus symbols to expand and collapse the individual groups that are displayed.