Summarize a Column in the Dashboard
Creating a summary for the numeric and monetary values in your dashboard is a nice and easy way to provide additional information about the items that are being displayed.
1. Click Dashboard
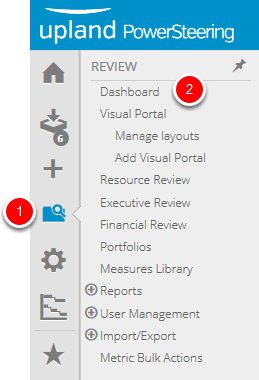
- On the Icon Bar click the Review button, then click Dashboard.
2. Select Column for Summary
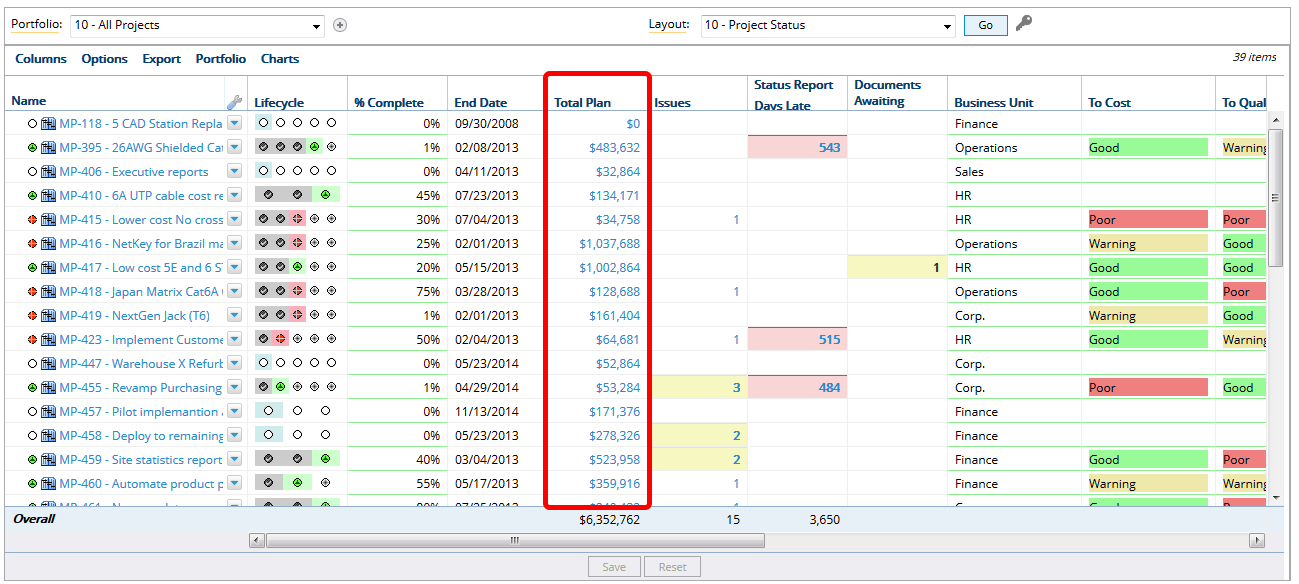
- Locate the column that you want to add a summary to on your dashboard.
3. Click Arrow
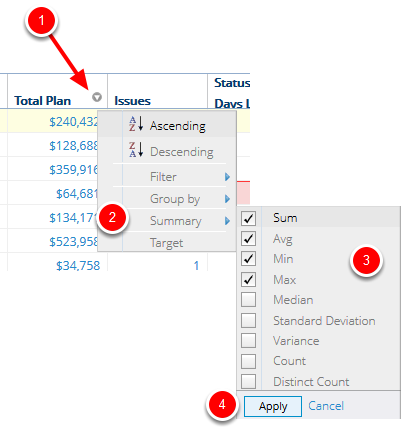
- Hover over the name of the column that you want to summarize until the context sensitive drop down arrow appears.
- Click the context sensitive drop down arrow, select Summary, select the check box(es) for the type of summary you want to add.
- Click Apply.
4. View Results
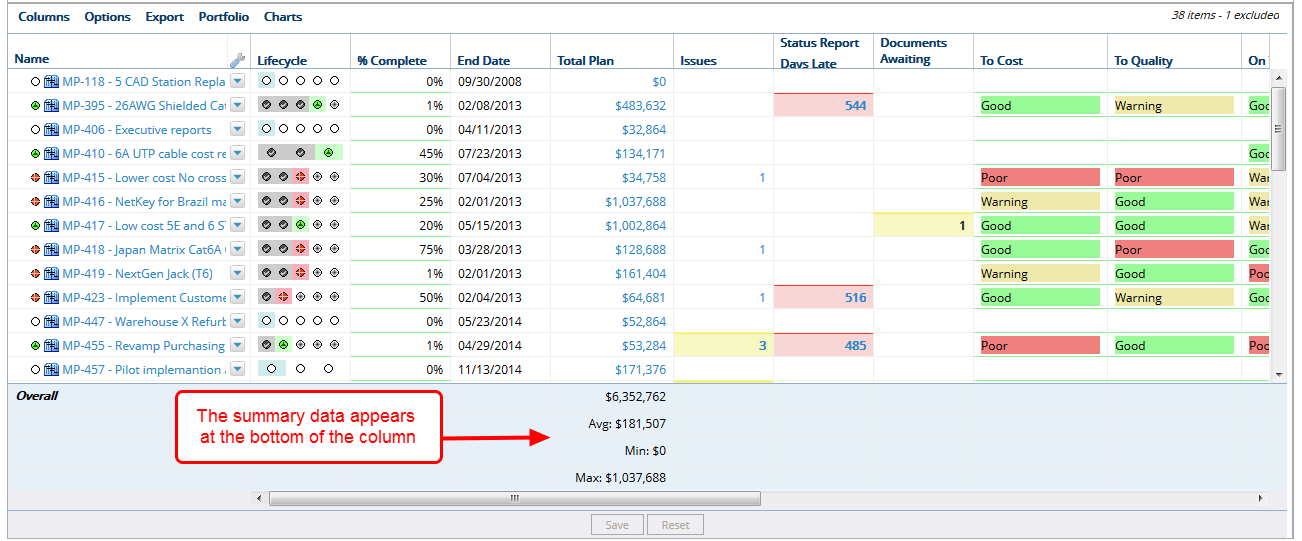
- View the summary data that appears at the bottom of the column.
4.1 View Grouped Results
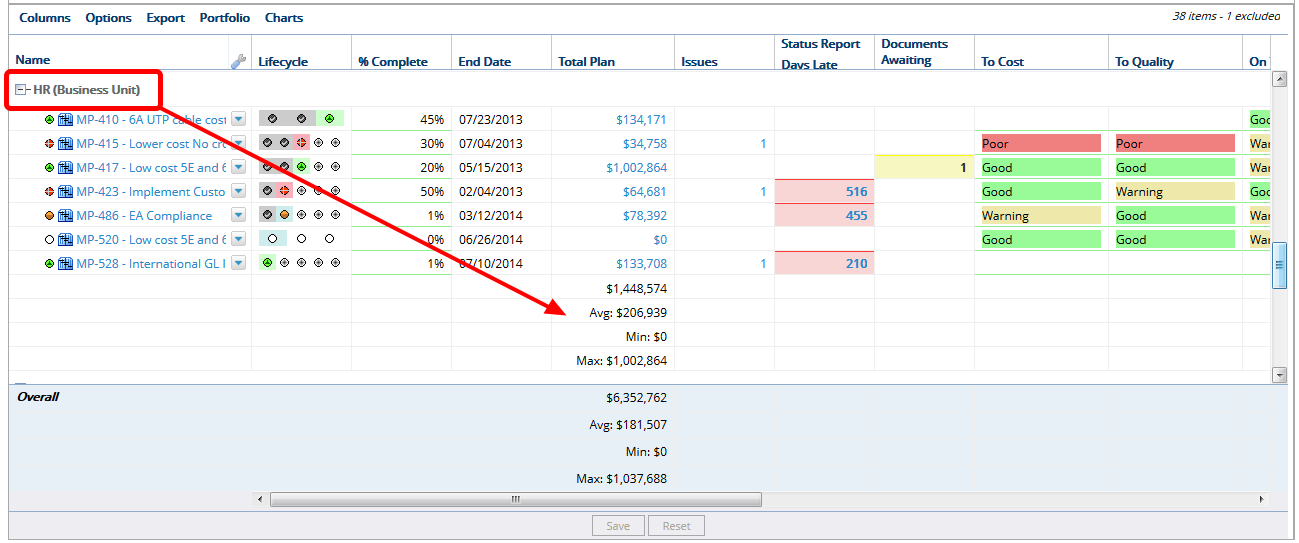
- View how the summary data appears when you add a grouping to your dashboard. The summary data appears at the bottom of each grouping and the bottom of the column. See Group Items on the Dashboard for more information.