Navigating the Dashboard - Time Trend
The Time Trend widget displays the number of feedback items received over time, broken down on a daily, weekly, monthly, and quarterly basis.
Note: The fields selected in this tab are reflected in the corresponding dashboard widget.
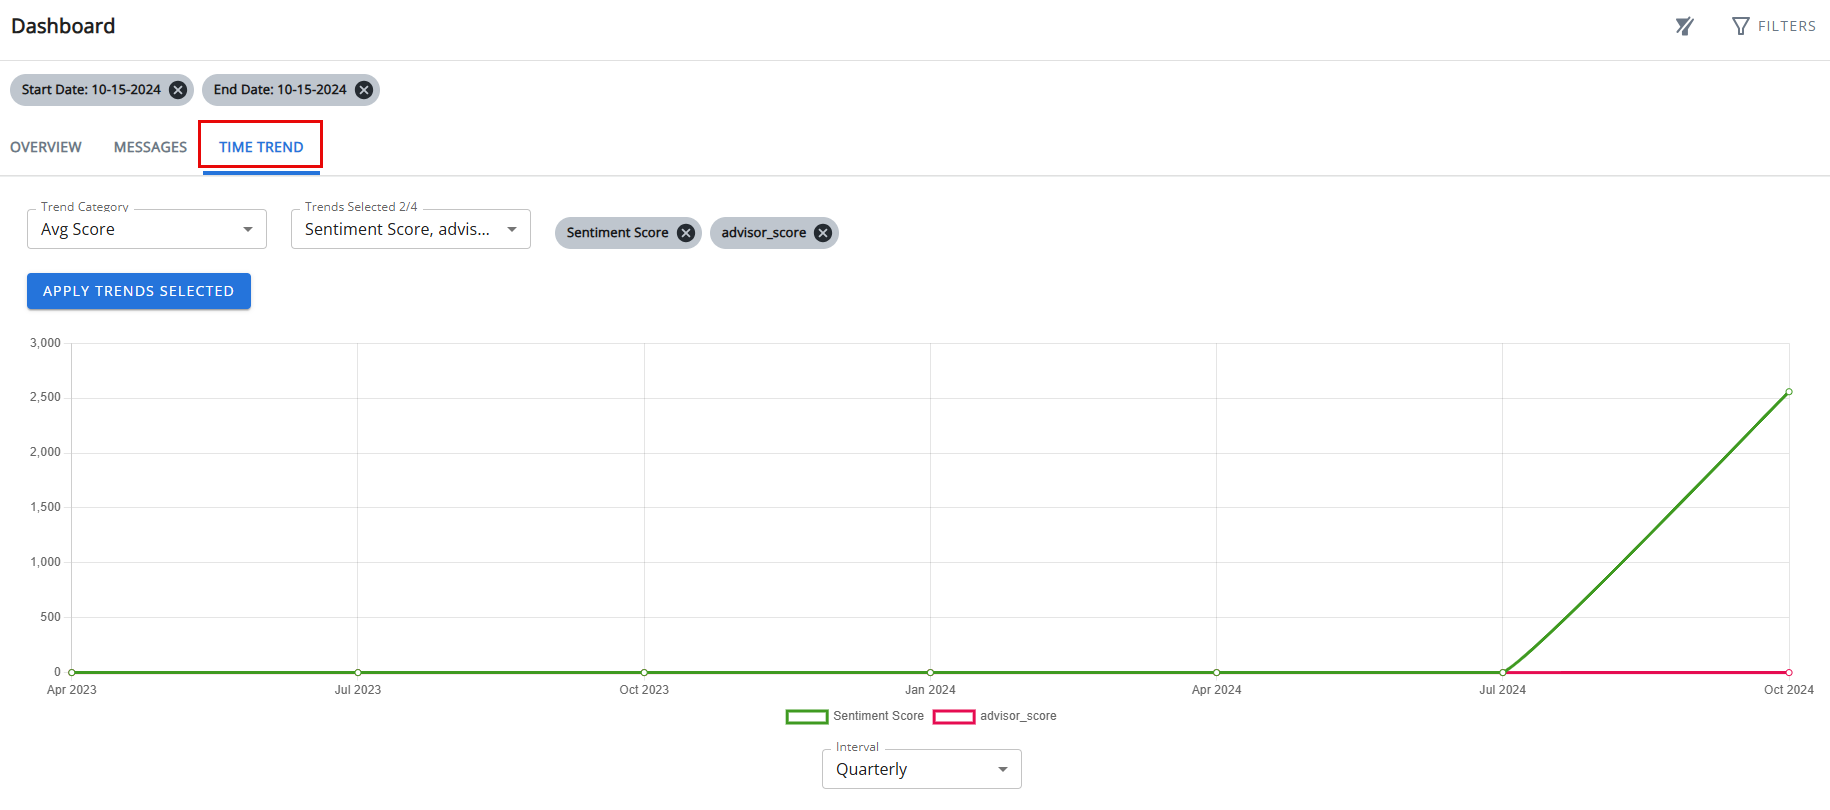
There are two fields where users must select trend parameters:
-
Trend Category: Choose between "Avg Score" or "Category".
-
Trends: Select up to four trends to display in the graph.
Once these fields are filled, Click Apply Trends Selected to display the corresponding graph. Additionally, a drop-down menu allows users to toggle between viewing trends on a Daily, Weekly, Monthly, or Quarterly basis.
To apply additional filters for viewing the trends, click the Filters button. The filters applied here will also be reflected on the dashboard and displays on the top of the page.