Analytics Spotlight Activity Dashboard
The Spotlight Activity dashboard displays details related to spotlight activity that can be used by Reference Managers.
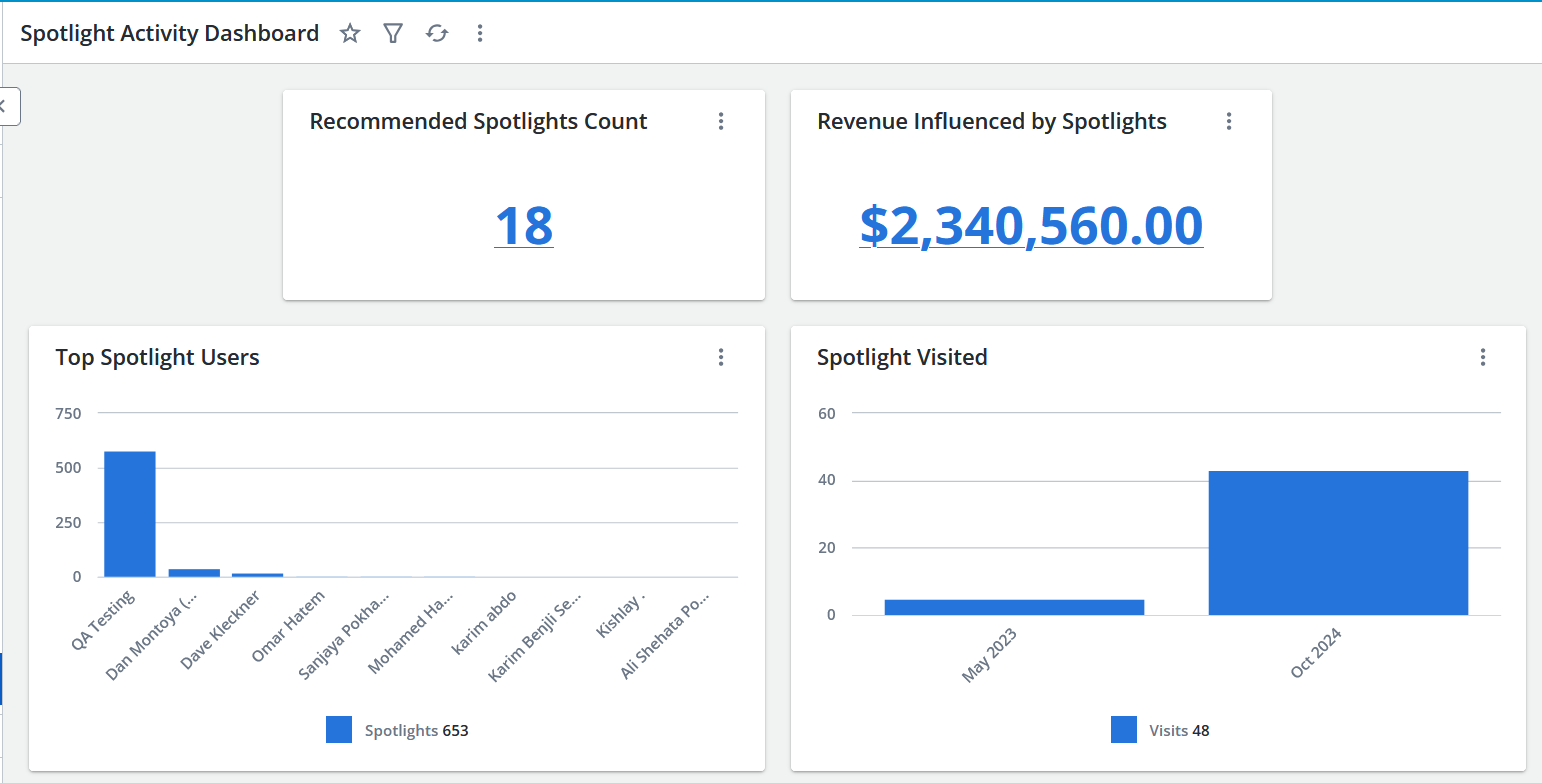
An example of the Upland Analytics Spotlight Activity dashboard.
Note: When a filter is applied, a header with the number of fields that were filtered appears on the dashboard. For more information on filters, see Apply an On-Page Filter - Dashboard.
Recommended Spotlight Count
The Recommended Spotlight Count chart shows a count of spotlights with the Recommended tag. You can drill down to the Spotlight List report to view the Spotlight titles.
Revenue Influenced by Spotlights
The Revenue Influenced by Spotlights chart shows the total revenue based on closed won opportunities (in the last 12 months) and the corresponding spotlights that were viewed. This KPI drills down to the Spotlight Revenue Influenced Detail report where you can view additional information.
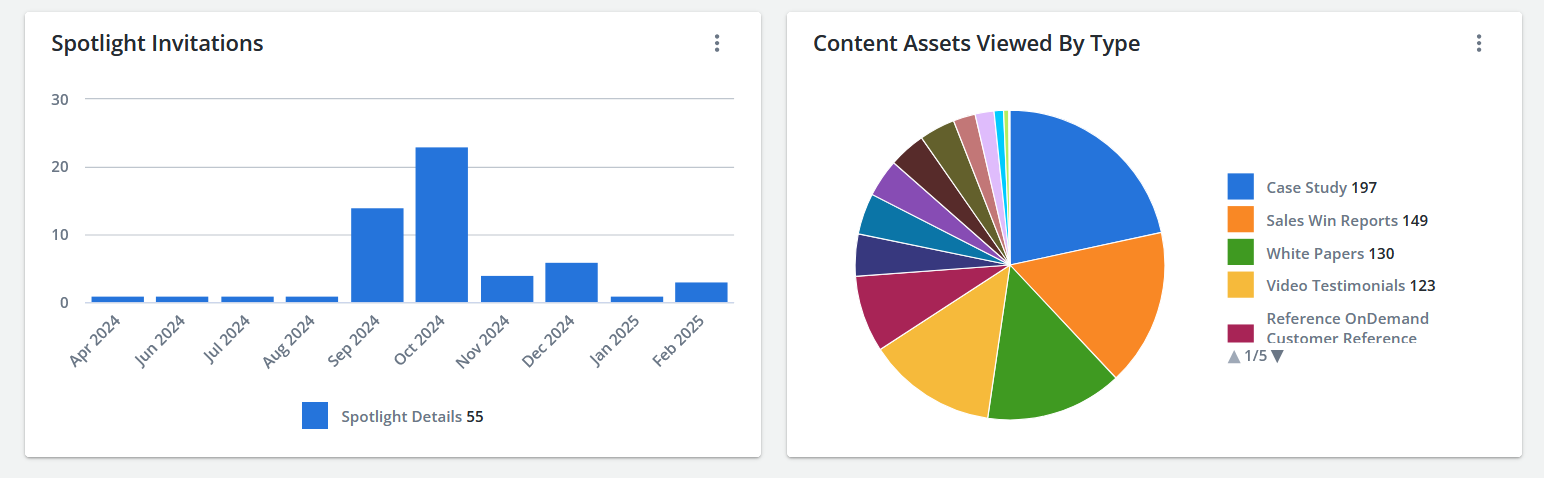
Spotlight Invitations
The Spotlight Invitations chart shows the count of spotlight invitations sent by month for the last 12 months (including the current month). You can drill down to the Spotlight Activity report to view additional information.
Spotlights Visited
The Spotlights Visited bar chart shows a count of visited spotlights by month for the last 12 months (including the current month). The horizontal axis shows the month and the vertical axis shows the number of visited spotlights.
Top Spotlight Users
The Top Spotlight Users bar chart shows spotlight invitations send by sales user for the top 5 sales users for the last 12 months (including the current month). You can drill down to the Spotlight Invitation Activity report to view additional information.
Content Assets Viewed by Type
The Content Assets Viewed by Type pie chart shows the viewed content assets by Type for the last 12 months (including the current month). You can drill down to the Spotlight Asset Usage report to view additional information.
Note: The Upland RO Innovation Help Center has information on Upland RO Innovation standard dashboards, fields, sources, and related events. To learn more about working with the dashboards and reports, see the Upland Analytics Help Center.