Analytics Stakeholder Dashboard
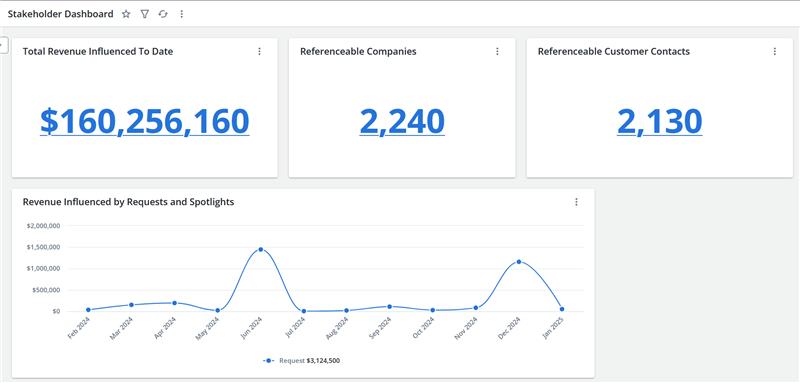
The Stakeholder dashboard displays high level information on the health of a program, the value it's providing, and any red flags. It also shows trends in terms of whether a program is growing or stagnating.
Note: When a filter is applied, a header with the number of fields that were filtered appears on the dashboard. For more information on filters, see Apply an On-Page Filter - Dashboard.
Key Performance Indicators
Total Revenue Influenced to Date
Total value of revenue influenced to current date. This KPI has a drill-down that shows a list of all opportunities that were won with the associated revenue.
Referenceable Companies
Total number of referenceable companies, defined in the system as currently active (not deactivated).
Referenceable Customer Contacts
Total number of customer contacts that are willing to participate in at least 1 reference activity.
Revenue Influenced by Requests and Spotlights
The Revenue Influenced line chart shows a monthly breakdown of total revenue influenced by requests and spotlights in the last 12 months (including the current month).
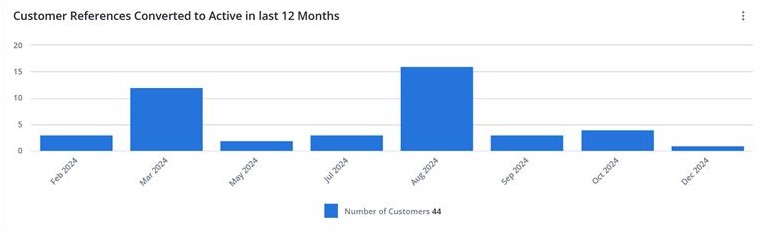
Customer References Converted to Active in Last 12 Months
The Customer References Converted to Active chart shows all customer references converted from "Recruited" to "Active" in the last 12 months (including the current month). Only new customers that are converted are included in this chart. This report drills down to a tabular report listing the referenceable customers.
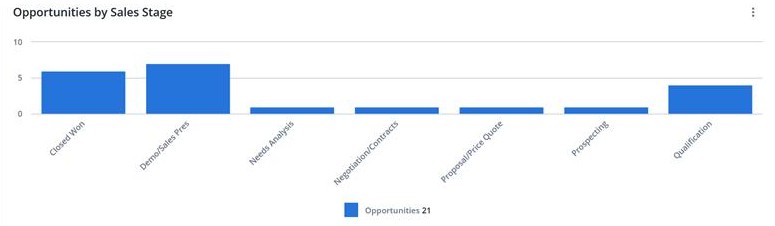
Opportunities by Sales Stage
The Opportunities by Sales Stage bar chart shows a breakdown of opportunities by stage. The opportunity count is listed on the vertical axis of the graph. The horizontal axis lists the various sales stages. This report drills down to a tabular report showing all opportunities.
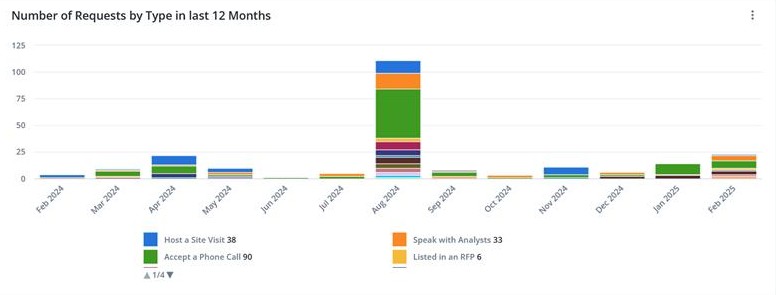
Number of Requests by Type in Last 12 Months
The Number of Requests by Type chart shows a monthly breakdown of request types in the last 12 months (including the current month). The request count is listed on the vertical axis of the graph. The bars are stacked by request type. This chart has two drill-down report options for additional request detail and the corresponding opportunities list.
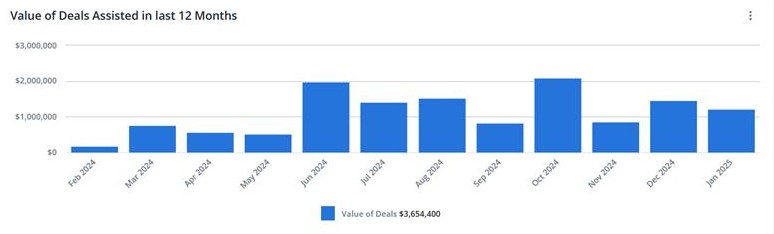
Value of Deals Assisted in Last 12 Months
The Value of Deals Assisted chart shows the total value of deals assisted (regardless of stage) by month in the last 12 months (including the current month). The aggregate assisted deal value won by month is listed on the vertical axis of the graph. The chart drills down to a tabular report that shows additional detail for the assisted deals.
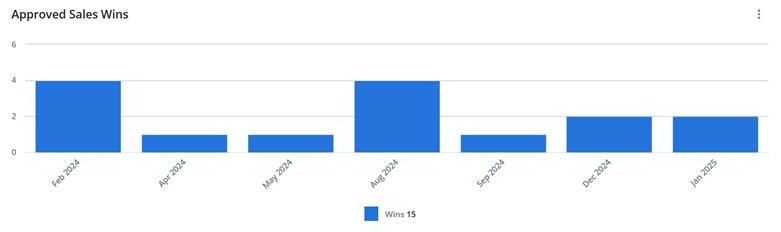
Approved Sales Wins
The Approved Sales Wins chart shows a monthly breakdown of approved sales wins in the last 12 months (including the current month). The chart drills down to a tabular report that lists the corresponding sales wins.
Note: The Upland RO Innovation Help Center has information on Upland RO Innovation standard dashboards, fields, sources, and related events. To learn more about working with the dashboards and reports, see the Upland Analytics Help Center.