Waterfall Chart Settings
Waterfall Graph Settings
-
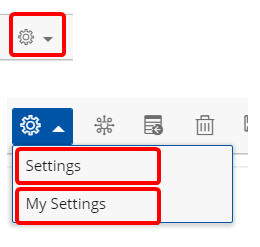
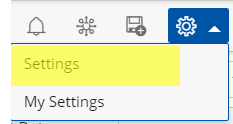
Click the Settings drop-down arrow to view the available options:
- Settings - available only to the Master Administrator or the report/graph creator.
- My Settings - available to users with the access rights to view the report/graph.
1. Settings
1.1. Access Settings
- Click Settings to access the Waterfall Settings.
1.2. Select a tab
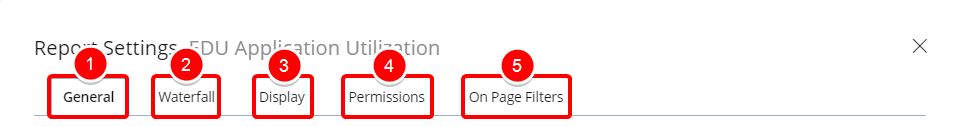
Select one or more of the desired options within the following tabs:
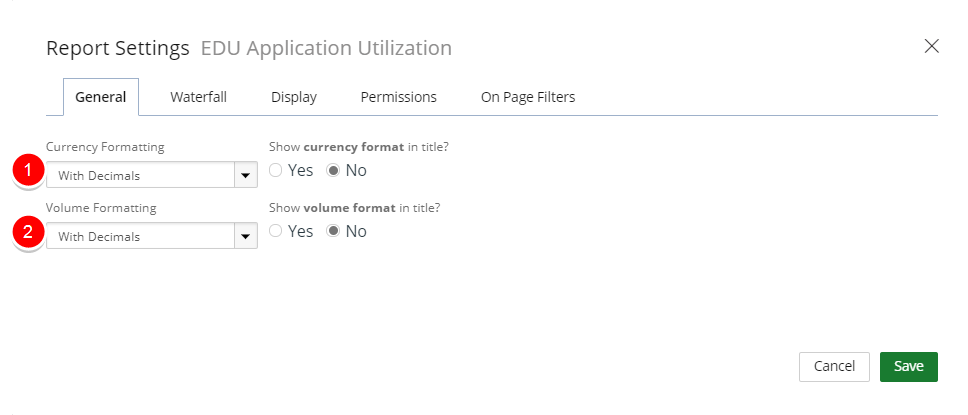
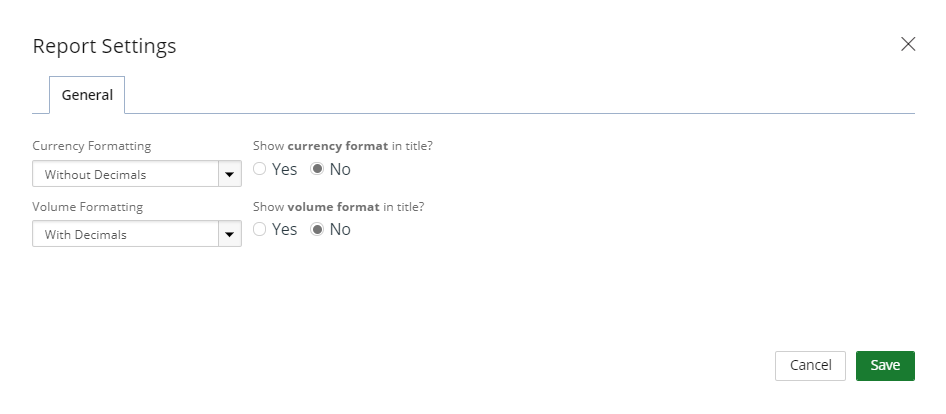
- Select one of the Currency Formatting options:
- Inherited: Selected by default
- With Decimals: 1,000.00
- Without Decimals: 1,000
- Thousands: 100,000.00 or 100,000
- Thousands with decimals: 100.00
- Millions: 1,000,000.00 or 1,000,000
- Millions with decimals: 1.00
- Select one of the Show currency format in title options:
- Yes to display the currency format in the report/graph title.
- No the currency format will not display in the report/graph title.
- Select one of the Volume Formatting options:
- Inherited: Selected by default
- With Decimals: 1,000.00
- Without Decimals: 1,000
- Thousands: 100,000.00 or 100,000
- Thousands with decimals: 100.00
- Millions: 1,000,000.00 or 1,000,000
- Millions with decimals: 1.00
- Select one of the Show volume format in title options:
- Yes to display the volume format in the report/graph title.
- No, the volume format will not display in the report/graph title.
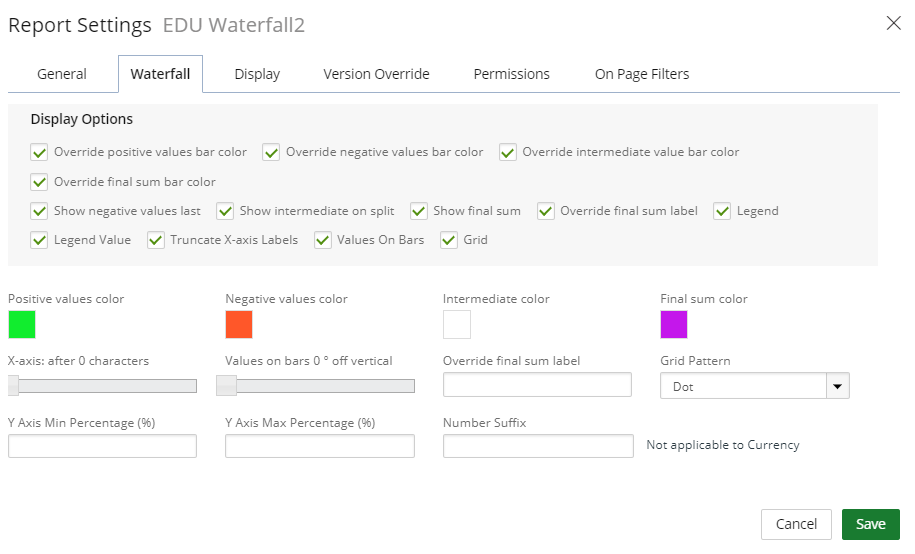
Available Display Options for a Waterfall Graph:
- Override positive values bar color: By default, the Override positive values bar color is not selected. Select this option and then select the color in the Positive values color box.
- Override negative values bar color: By default, the Override negative values bar color is not selected. Select this option and then select the color in the Negative values color option.
- Override intermediate value bar color: By default, the Override intermediate value bar color is not selected. Select this option and then select the color in the Intermediate color box.
- Override final sum bar color: By default, the Override final sum bar color is not selected. Select this option and then select the color in the Final sum color box.
- Show negative values last: By default, Show negative values last is not selected. When selected the negative values will show as last items in your chart.
- Show intermediate on split: By default, Show intermediate on split is not selected.
- Show final sum: By default, Show final sum is not selected. When selected the final sum will be shown on your chart.
- Override final sum label: Select this checkbox and type the desired text in the Override final sum label field to rename the Final Sum label.
- Legend: By default, Yes is selected. Selecting no to this option will remove the labels of your data values from the chart.
- Legend Value: By default, Yes is selected. Selecting no to this option will remove the text and numeric values from the chart.
- Truncate X-axis Labels: Select this checkbox and move the X-axis after slider to select the number of characters to display to shorten the x-axis labels.
- Values On Bars: By default, Values On Bars is not selected. Selecting this option shows the total amount at the top of the data bar. Move the Values on bars 0 off vertical slider to adjust the scale 0 - 90 degrees.
- Grid: By default, Grid is not selected. Selecting this option allows you to show the grid layout within your graph. In the Grid Pattern field, select any of the available options for grid. By default, Solid Lines is selected.
- Y Axis Min Percentage: This options allows you to zoom into your graph based on the lowest percentage.
- Y Axis Max Percentage: This options allows you to zoom into your graph based on the highest percentage.
- Number Suffix: You can append a number or text value in front vertical numeric values within your chart. (Not applicable to Currency)
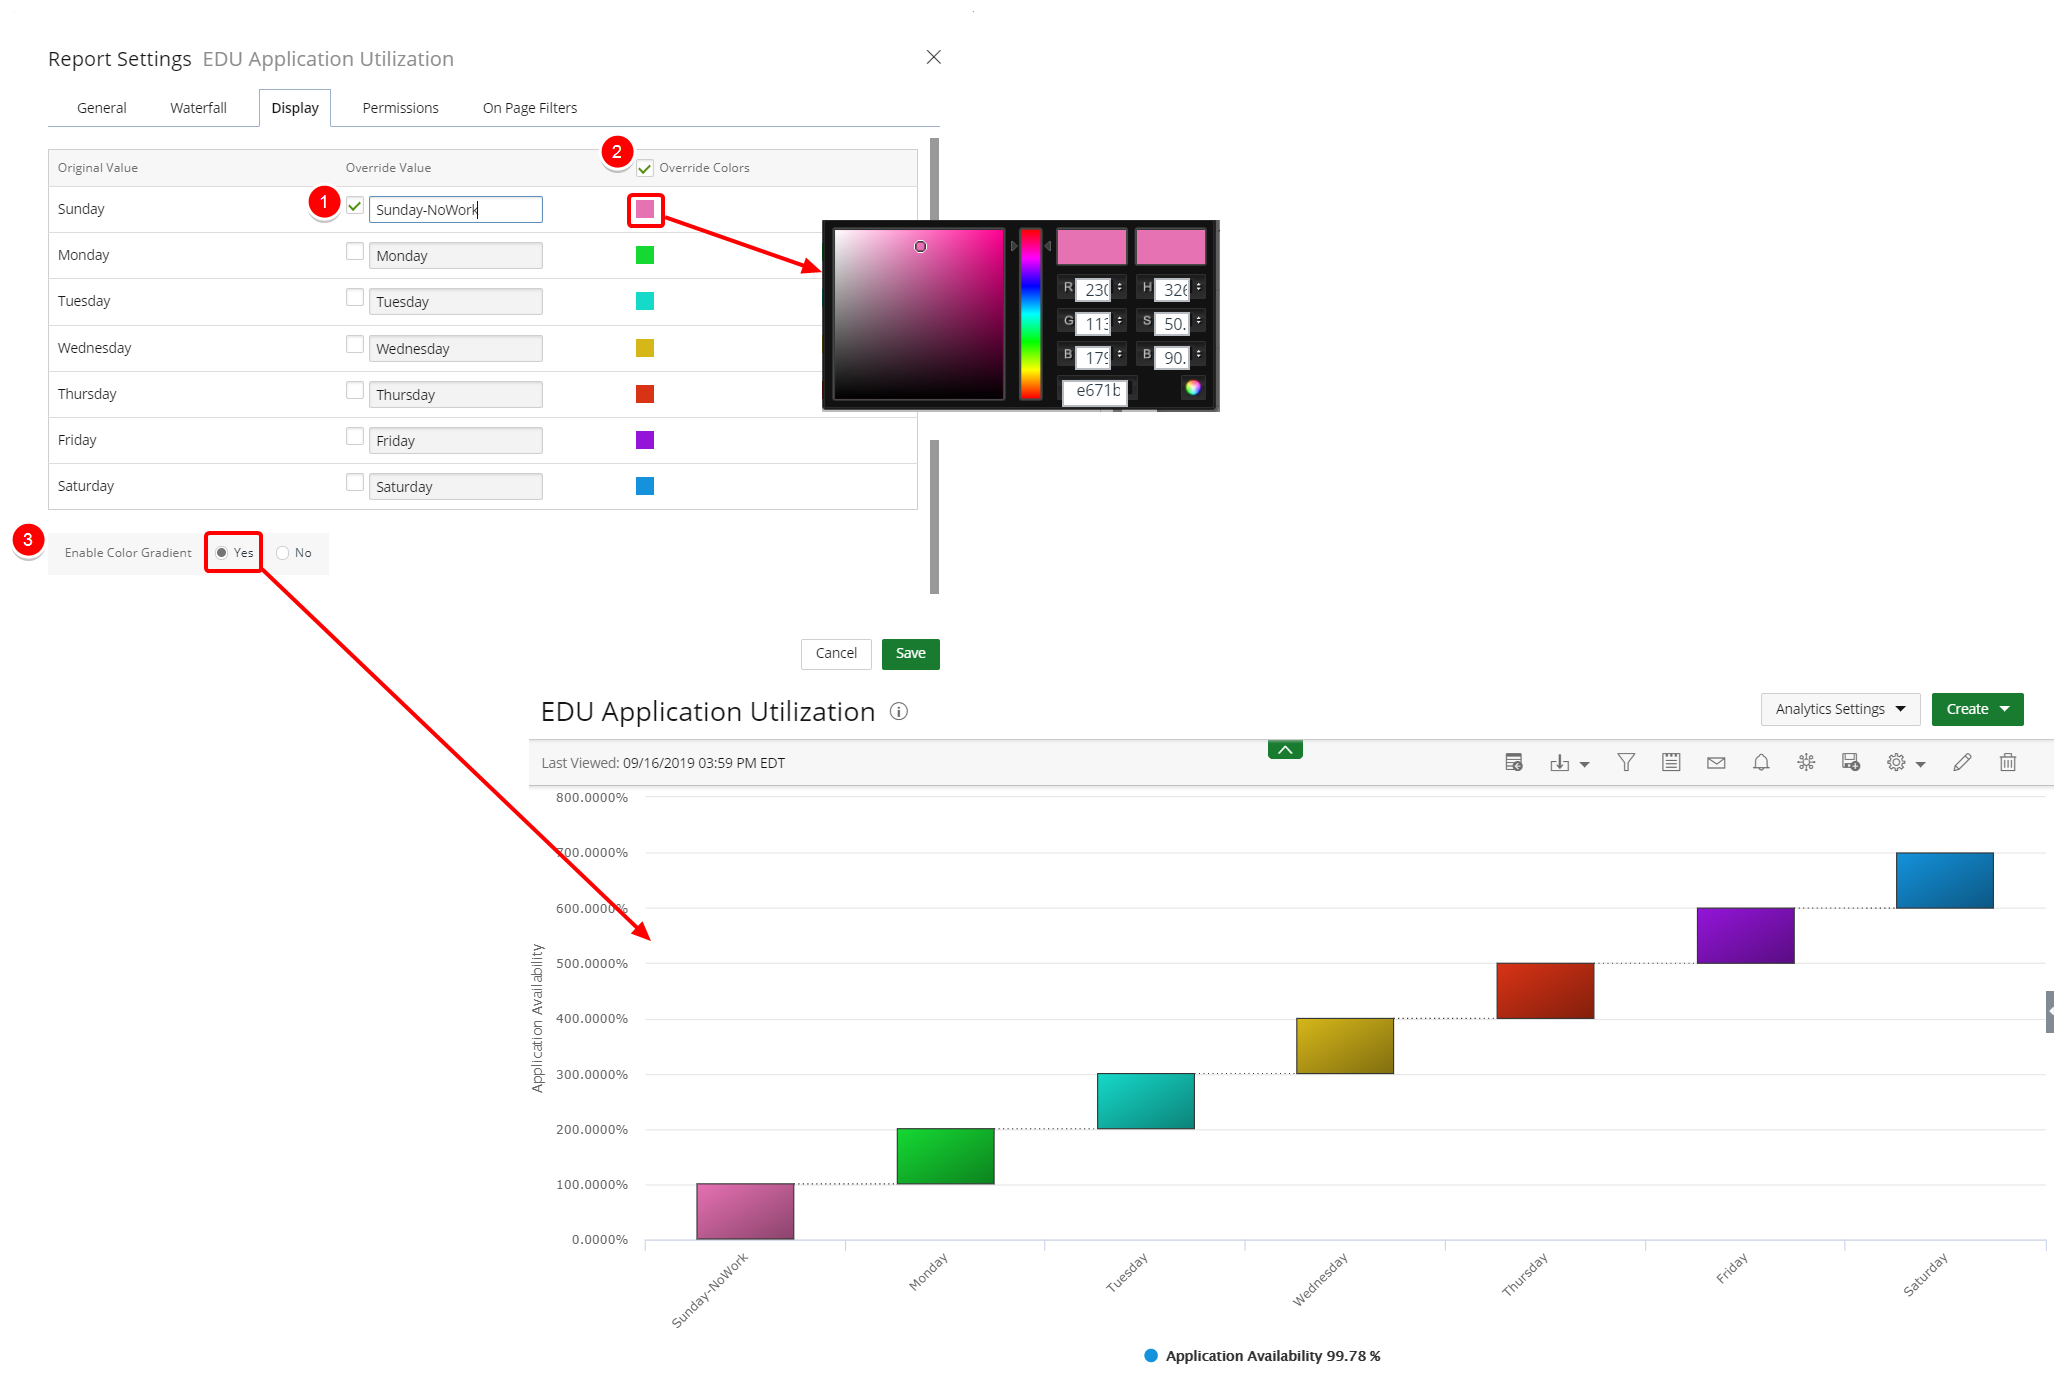
Within the Display tab you can change the Original Label Value and colors of the bars.
- Select the Original Label Value you want to override and type the new Override Value in the box.
- Select Override Colors, then click on the color and make a new color selection.
-
Enable Color Gradient: Select one of the following:
- Yes to display the bars in your Waterfall graph in gradient colors instead of solid colors.
- No to display the bars in your Waterfall graph in solid colors.
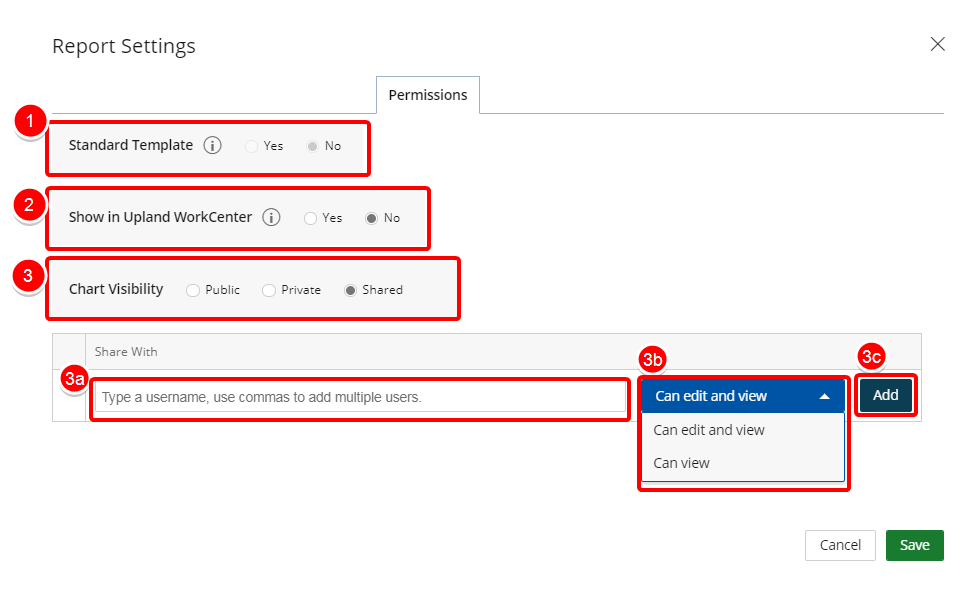
- Select Yes/No for Standard Template.
- Select Yes/No for Show in Upland WorkCenter to allow the report to display in Upland WorkCenter.
- Select your Report/Chart Visibility.
- Public: By default, this option is selected. This option allows your graph to be viewed by all users.
- Private: This option allows your graph to be viewed by you only.
- Share: This option allows you to set your graph to be viewed by a specific user(s) or role(s) and give permissions. The Shared With field displays:
- Click the Select a value field and select the user(s) or role(s) to share your graph with.
- Click the arrow and select the permission for each user or role. The available options are:
- Can edit and view: The default
- Can view
- Click Add.
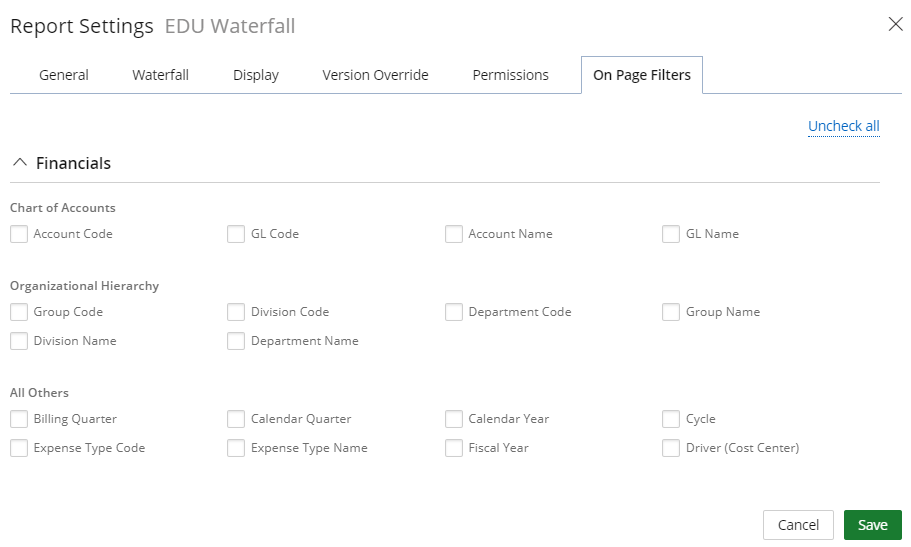
- Select the options you would like to make available for filtering on your Waterfall Chart.
2. My Settings
2.1. Access My Settings
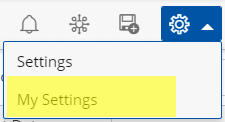
- Click My Settings to access your Waterfall Chart Settings.
2.2. General tab
Select how Numbers should be displayed on your Waterfall:
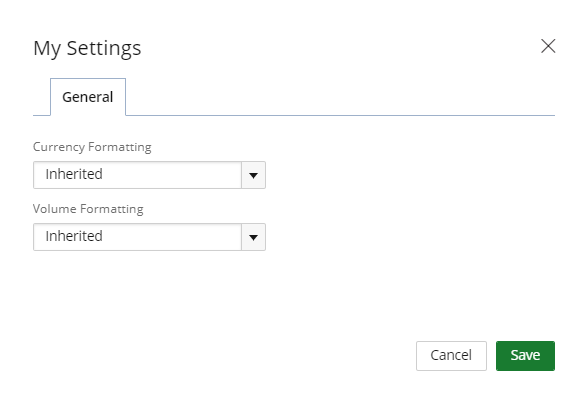
- Select one of the Currency Formatting options:
- Inherited: Selected by default
- With Decimals: 1,000.00
- Without Decimals: 1,000
- Thousands: 100,000.00 or 100,000
- Thousands with decimals: 100.00
- Millions: 1,000,000.00 or 1,000,000
- Millions with decimals: 1.00
- Select one of the Volume Formatting options:
- Inherited: Selected by default
- With Decimals: 1,000.00
- Without Decimals: 1,000
- Thousands: 100,000.00 or 100,000
- Thousands with decimals: 100.00
- Millions: 1,000,000.00 or 1,000,000
- Millions with decimals: 1.00
Menu