Create a New Dashboard
1. Create Dashboard
Access the Dashboard Settings modal by:
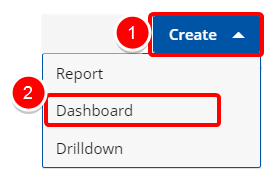
- Clicking the Create button from on the Main Menu Bar.
- Then select Dashboard from the menu.
2. Customize Your Dashboard
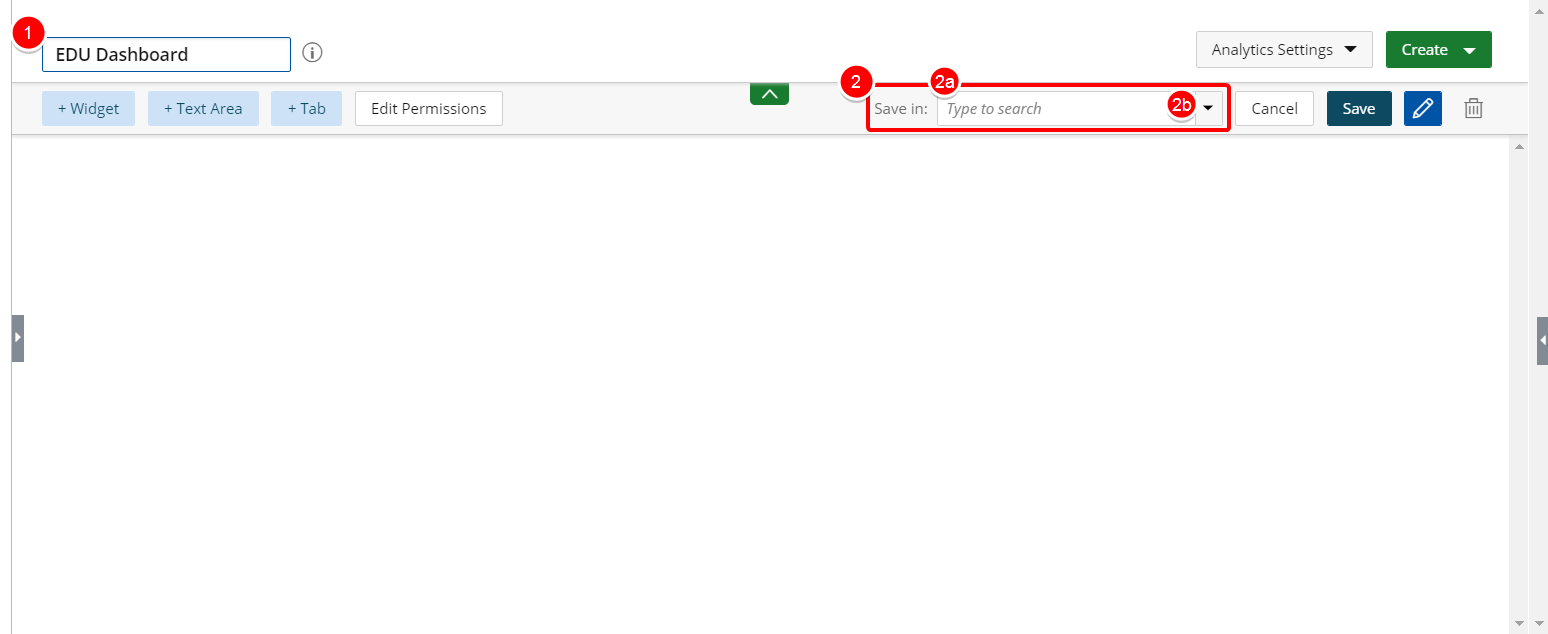
- Enter a name for the new Dashboard.
- Click the Save In drop down arrow to view and select an available folder where your dashboard will be saved.
- Type to search: Enter values in this box to filter and find the folder where your dashboard will be saved.
- Click the arrow to view and select an available folder where your dashboard will be saved, or select Add New Folder to create a new folder where your dashboard will be saved.
2.1 Add Widgets
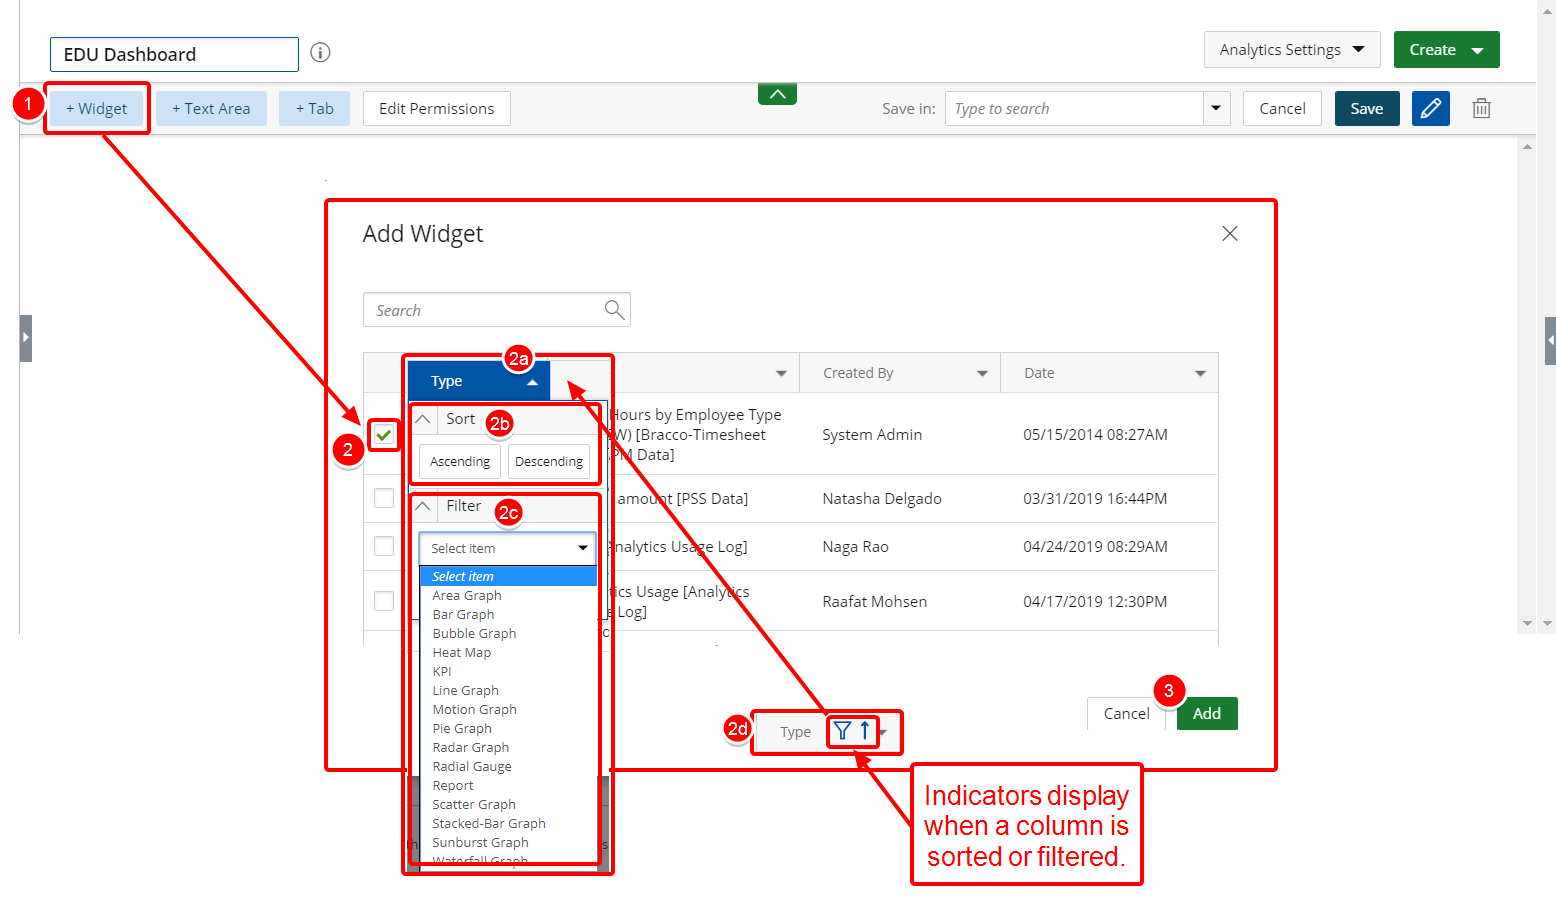
- Click the Widget button.
- Select the widgets you wish to view on your Dashboard. Sort and filter the Type, Name, Created By, and Date columns as desired:
- Click the arrow button next to the desired column.
- Select Ascending or Descending to sort the column.
- Click the arrow button next to Select item and select the item to filter by.
- An icon displays when the column is sorted and/or filtered.
- Click the Add button.
- Repeat steps 1 - 3 as necessary.
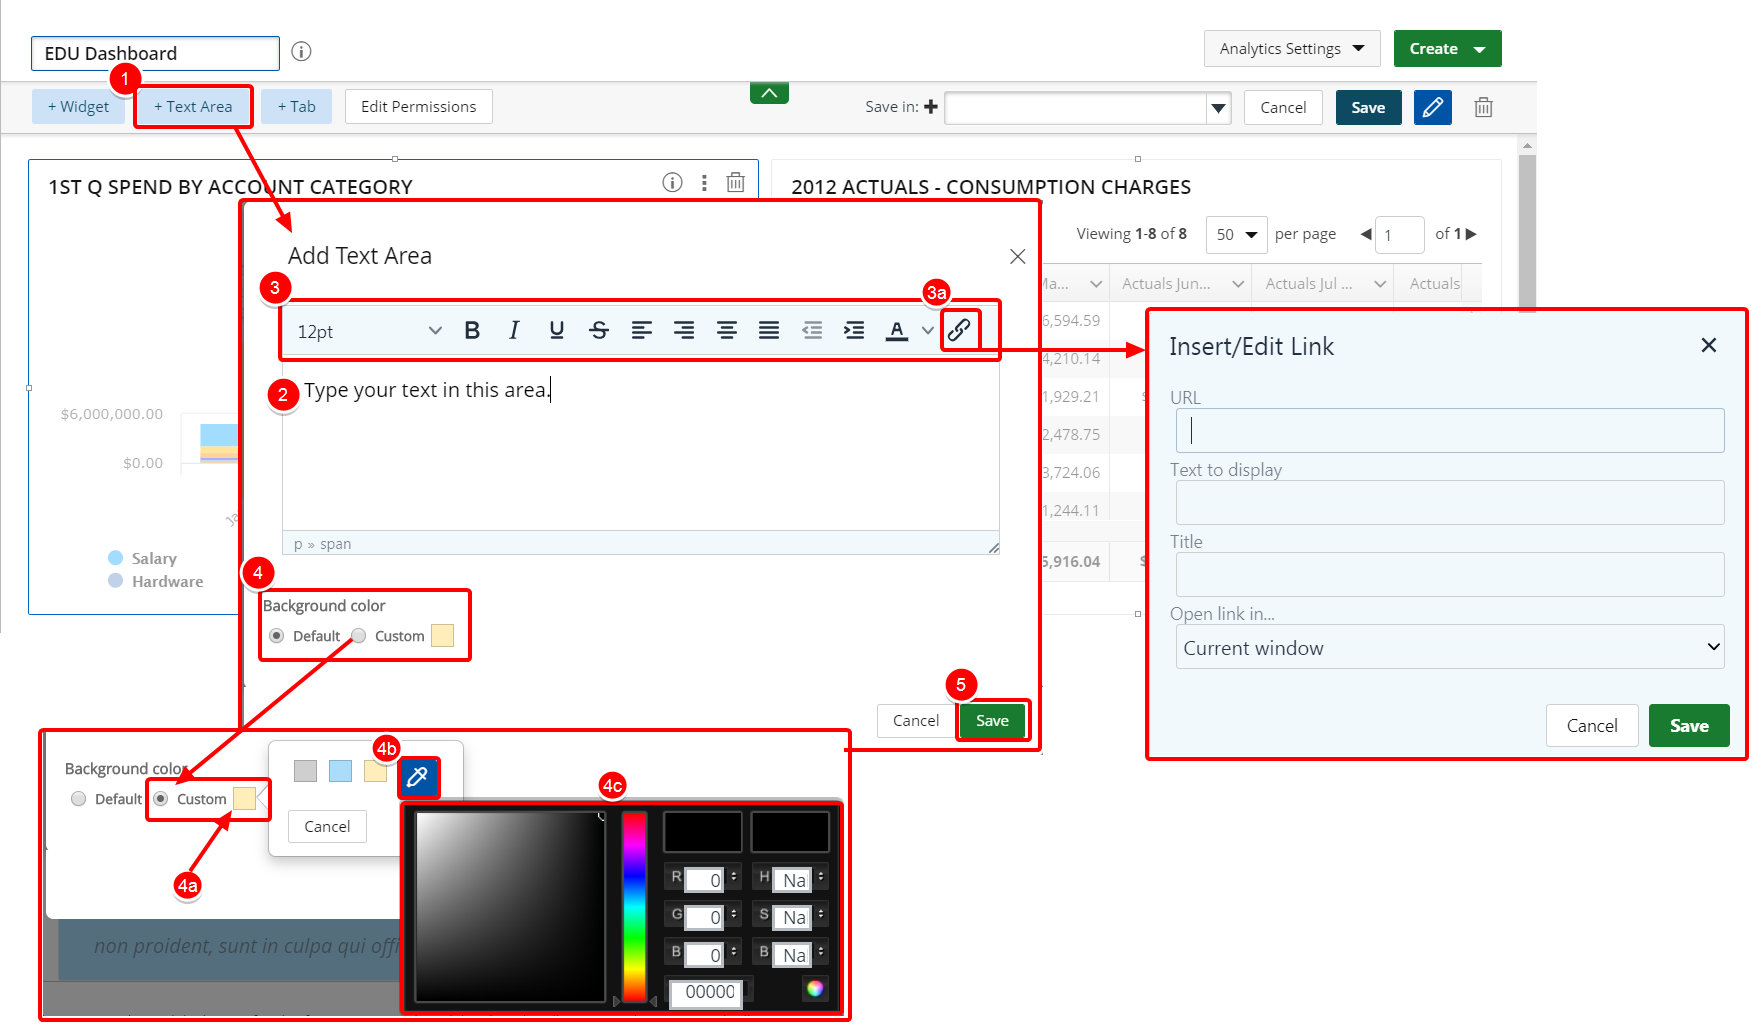
- Click the Text Area button. The Add Text Area window displays.
- Enter your text in the text area.
- Optionally, select the text in the text area and apply available formatting options.
- Click the Insert/edit link button to insert a hyperlink. The available fields are as follows:
- URL: Type or paste the address link.
- Text to display: Type the text you want to use for the link.
- Title: Type the you want to display when a user hovers over the link.
- Open link in: Click the arrow and select one of the available options:New window or Current window.
- To change the background color, click Custom in the Background color section.
- Click the custom color.
- Select one of the main colors or click
 to open the color picker.
 -
Use the fields in the Color Picker to create the desired color, and then click
 .
. - Click Save to save the text area.
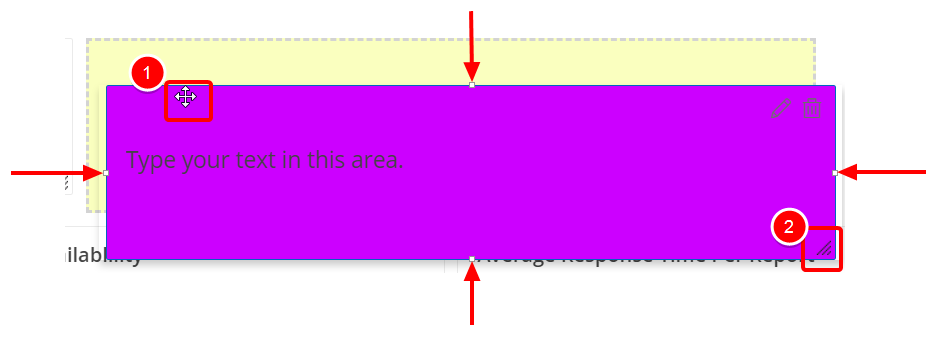
- Drag and drop the text area to move it on the dashboard.
- Drag the corner or the sides of the text area to resize it.
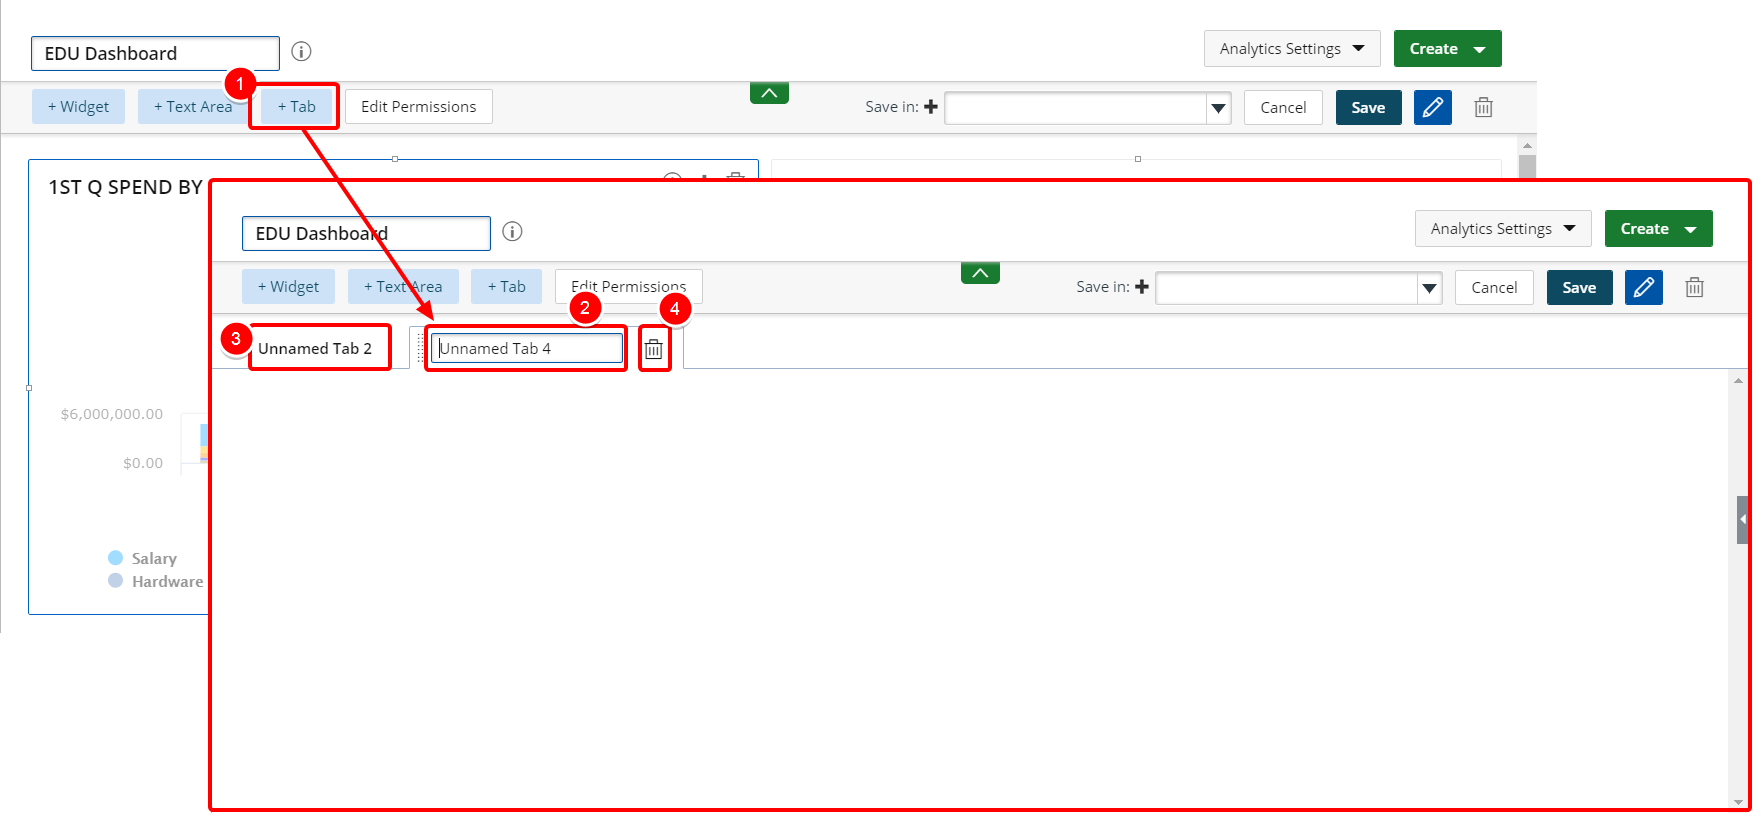
- Click the Tab button. An empty new tab displays.
- Optionally, enter a name for the new tab.
- Optionally, rename the first tab.
- Click Delete to delete the tab.
- Add widgets as necessary.
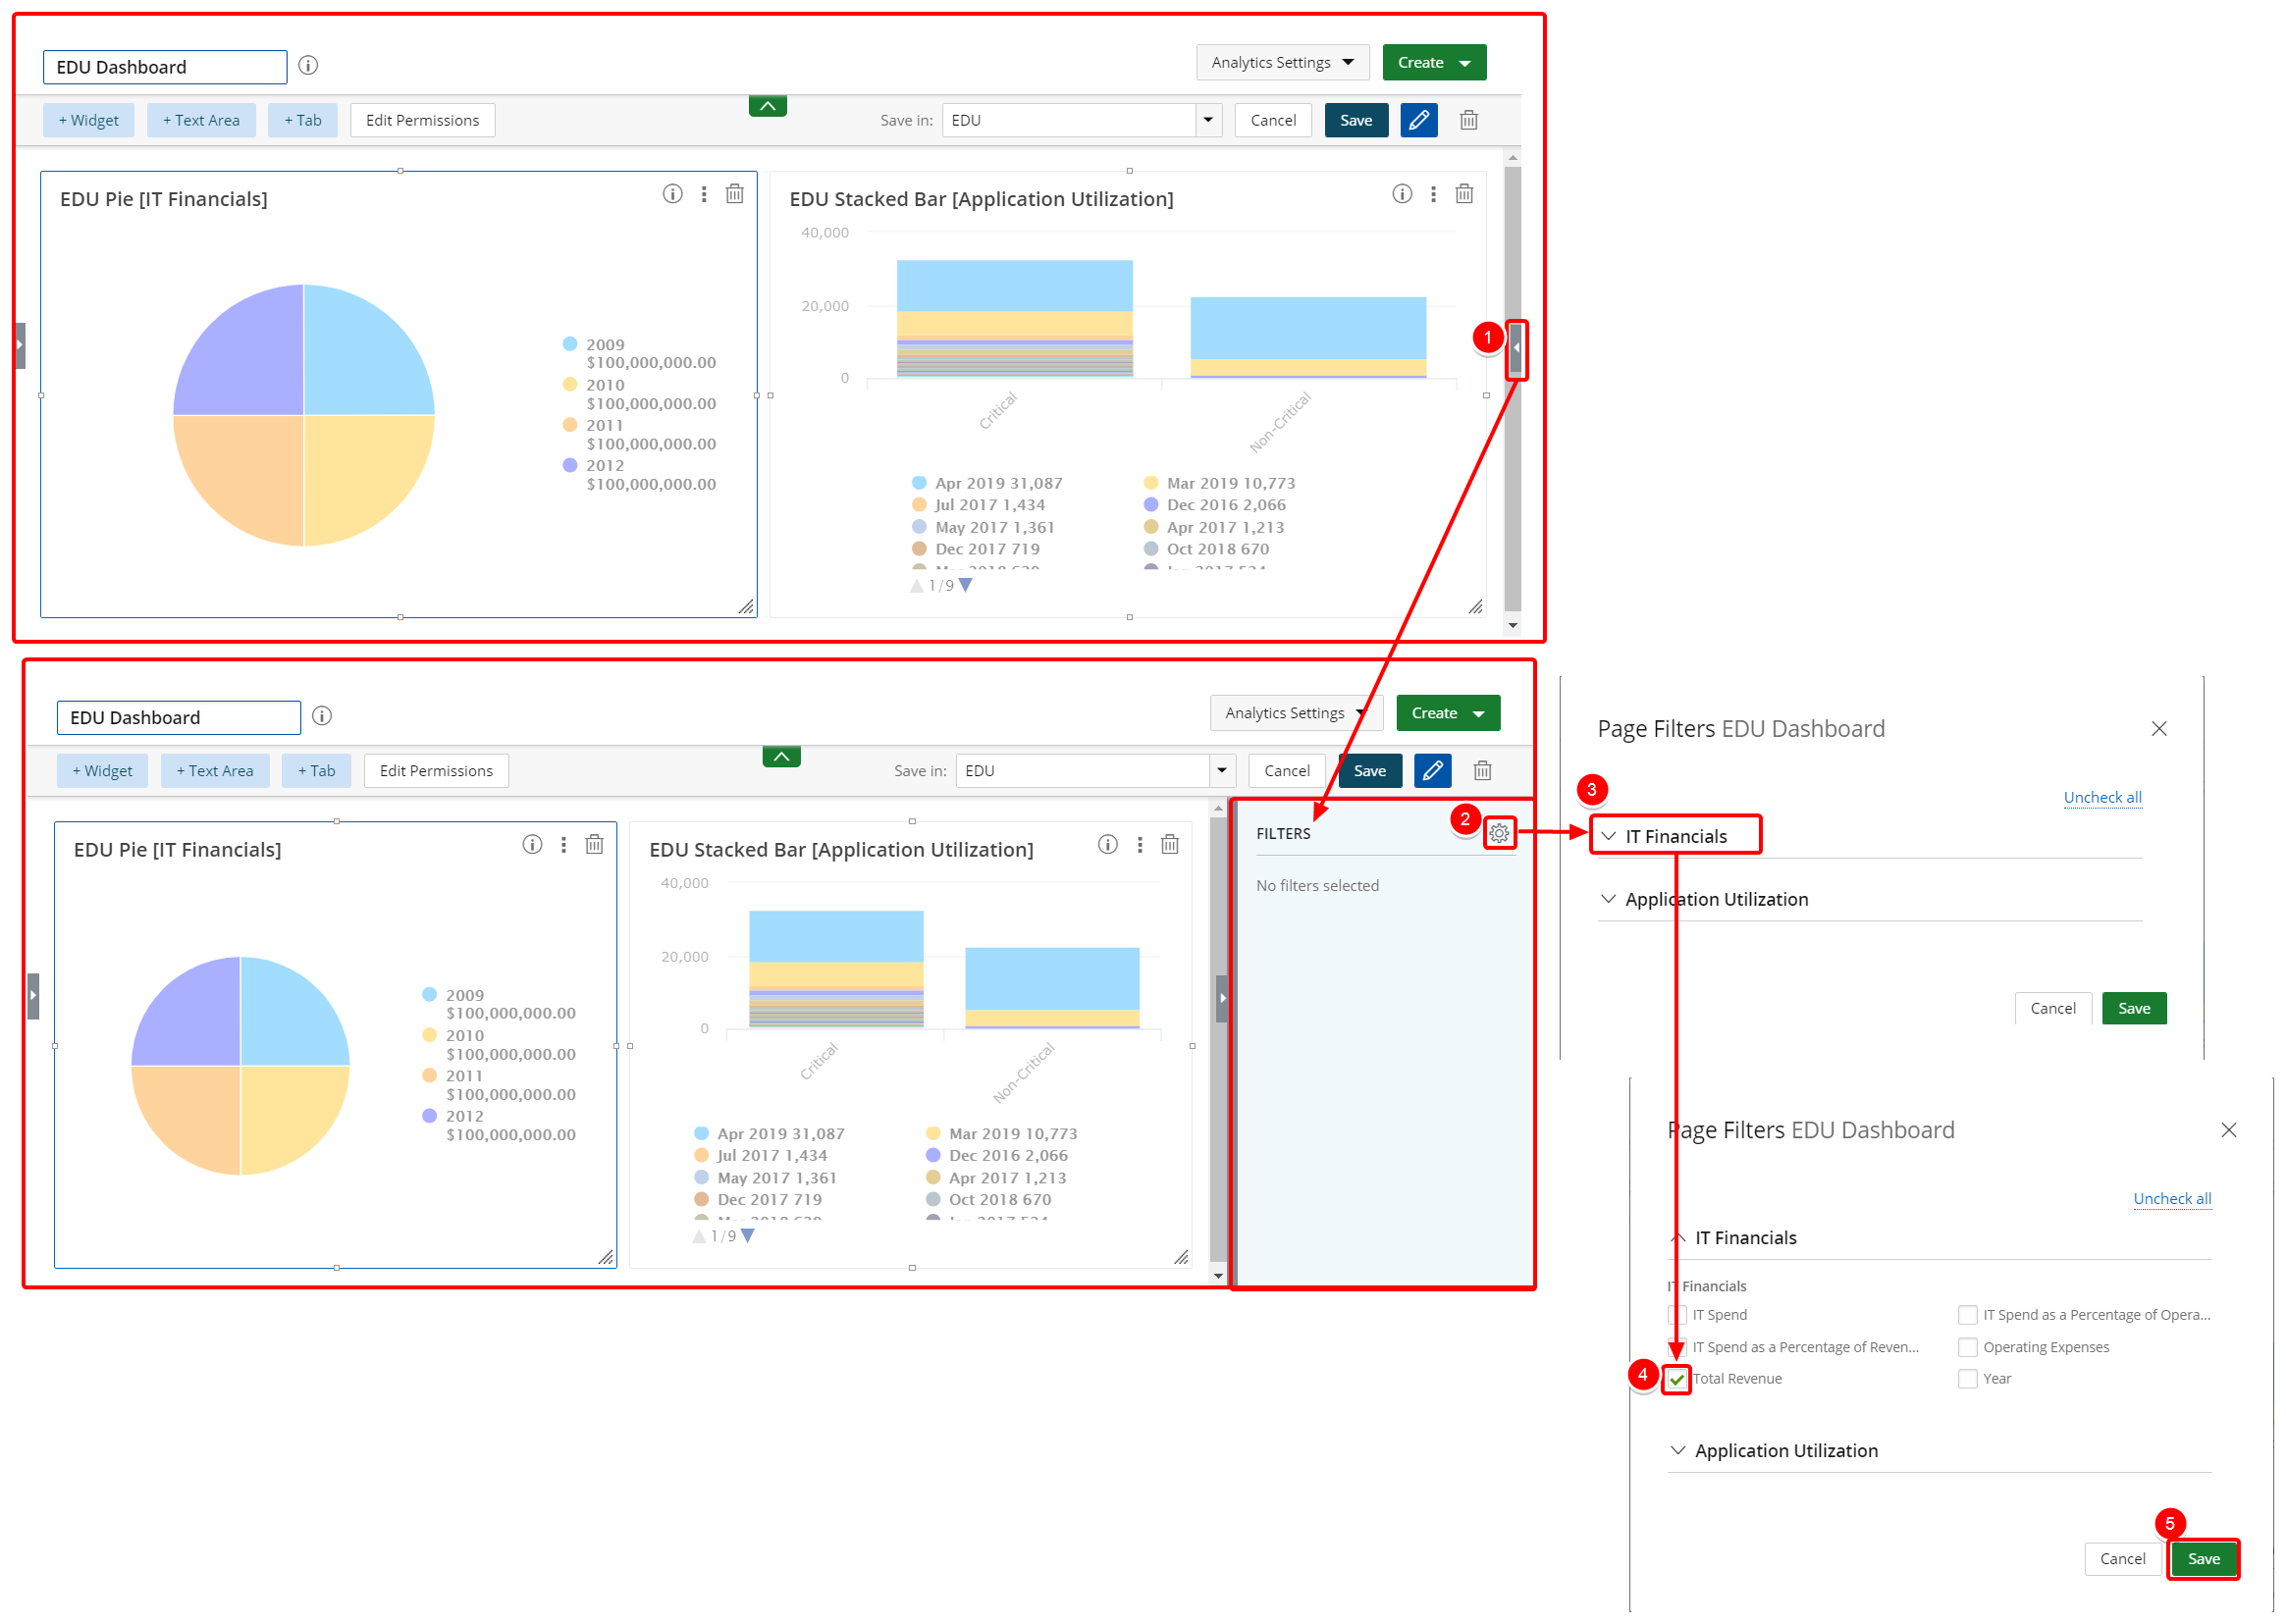
Select the options you would like to make available for filtering on your Dashboard view.
- Click the arrow to open the Filter Drawer.
- Click the Settings button. The Page Filter tab displays.
- Click on a heading to expand all available options
- Select the options as desired.
- Click Save to view your Dashboard.
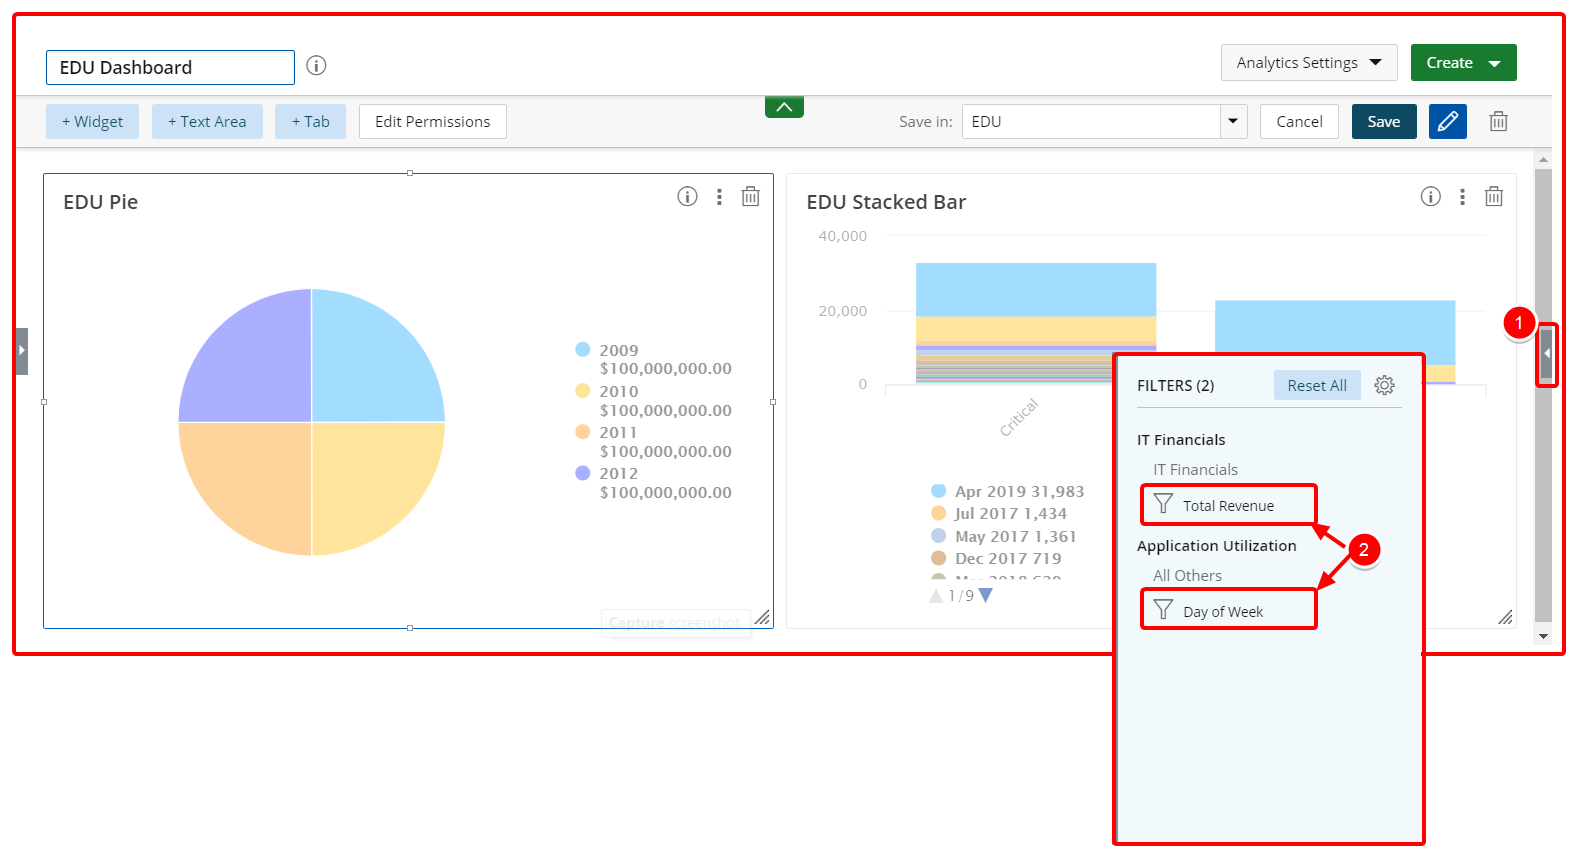
- Click the arrow to open the Filter Drawer.
- In the Filter Drawer, select the field you wish to apply the filter on. The filters that are available to you depend on the data type of the field that you selected. See Applying Filters for more information about the different filter types.
- Click Apply Filter. The filter icon changes to indicate that the filter is applied.
3. View your Dashboard and Edit the Layout
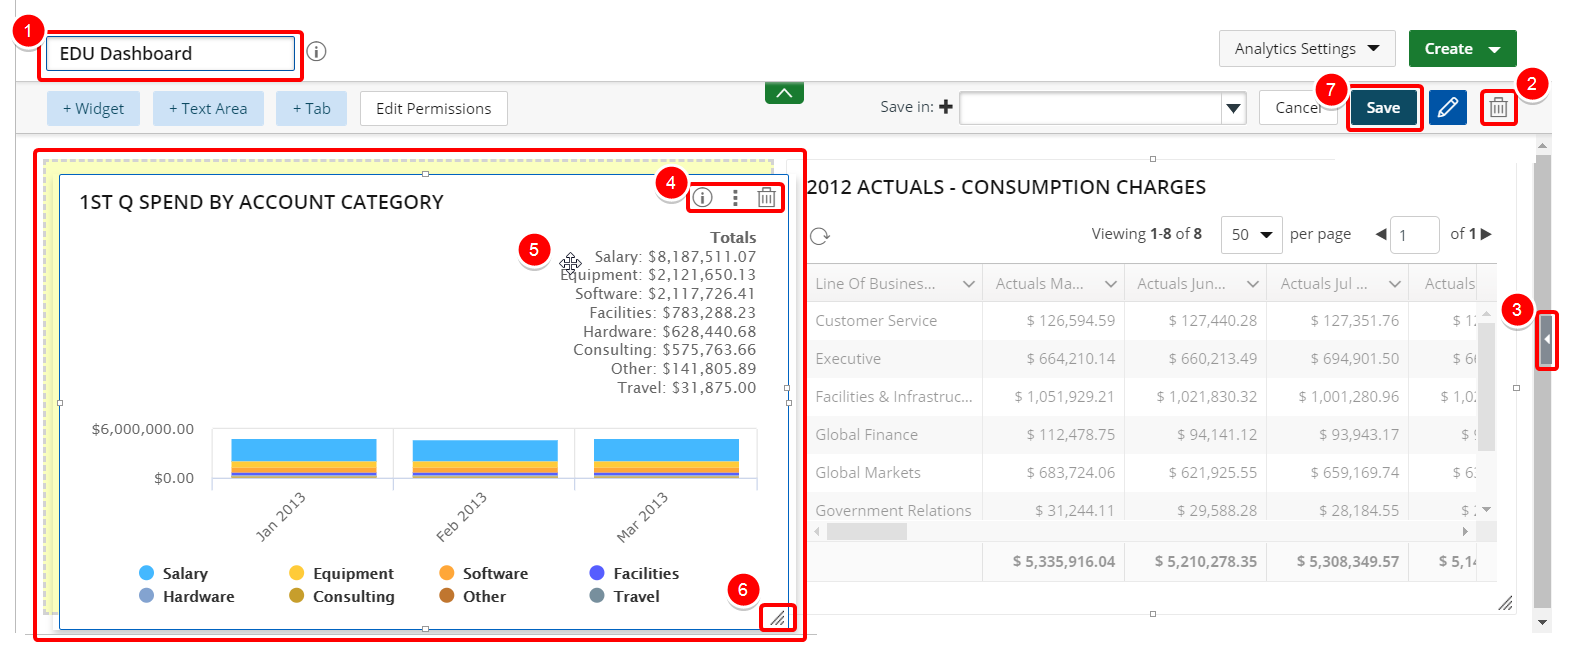
Your Dashboard is unlocked and can be edited.
- Enter a new name to change the name of your Dashboard.
- Delete: Click this button to delete your Dashboard.
- Filters: Click to open the Filter Drawer.
- Available Actions are:
- Details: Click to view the Widget Details.
- Widget options: Click to access the widget options: Edit, Settings, and My Settings.
- Delete: Click this button to delete the Widget from your Dashboard.
- Click the widget to reposition it.
- Select the bottom right corner of a widget to re-size it.
- Click the Save button to save your Dashboard.

Click one of the following:
|
|
|


4. View Saved Dashboard
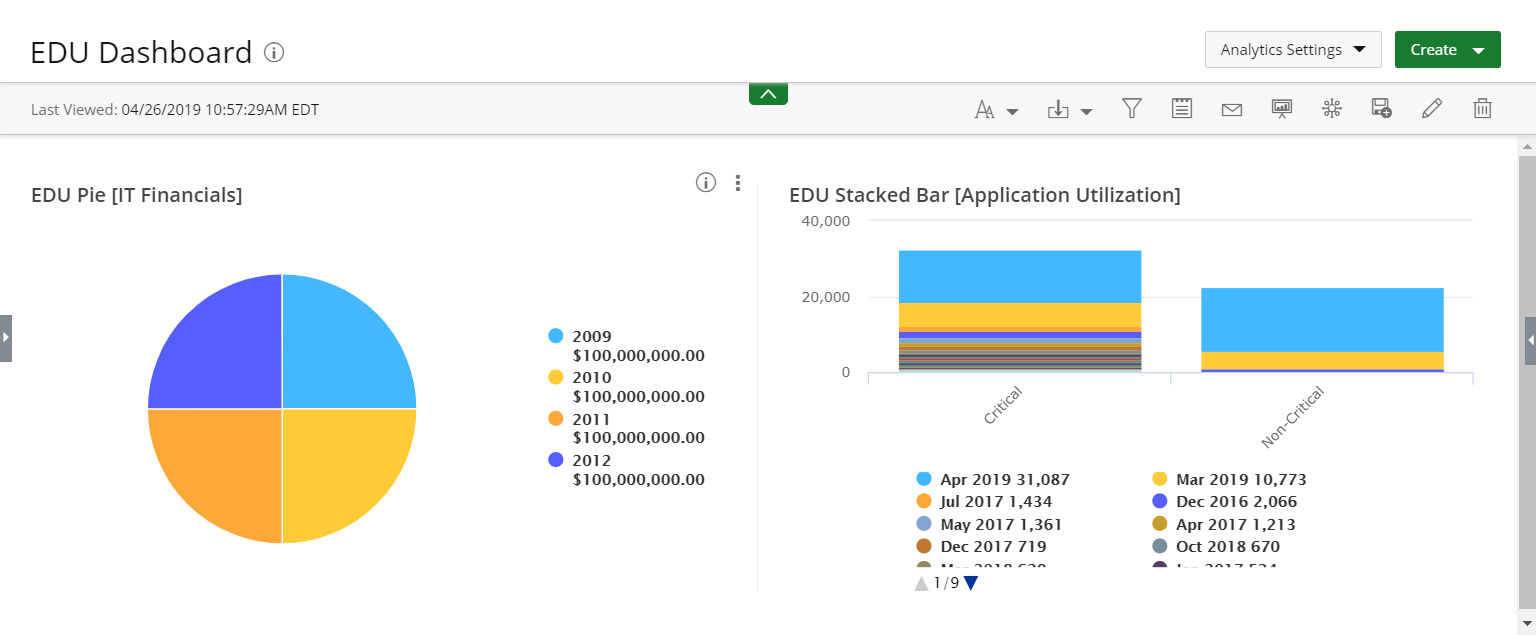
- View your saved Dashboard.
Menu