This topic contains information about what’s new and resolved as of Upland Analytics 2018 R1.6.
Stories
With this release, we have added the functionality to allow users to download and email KPIs. The icons are now available on the Action bar.
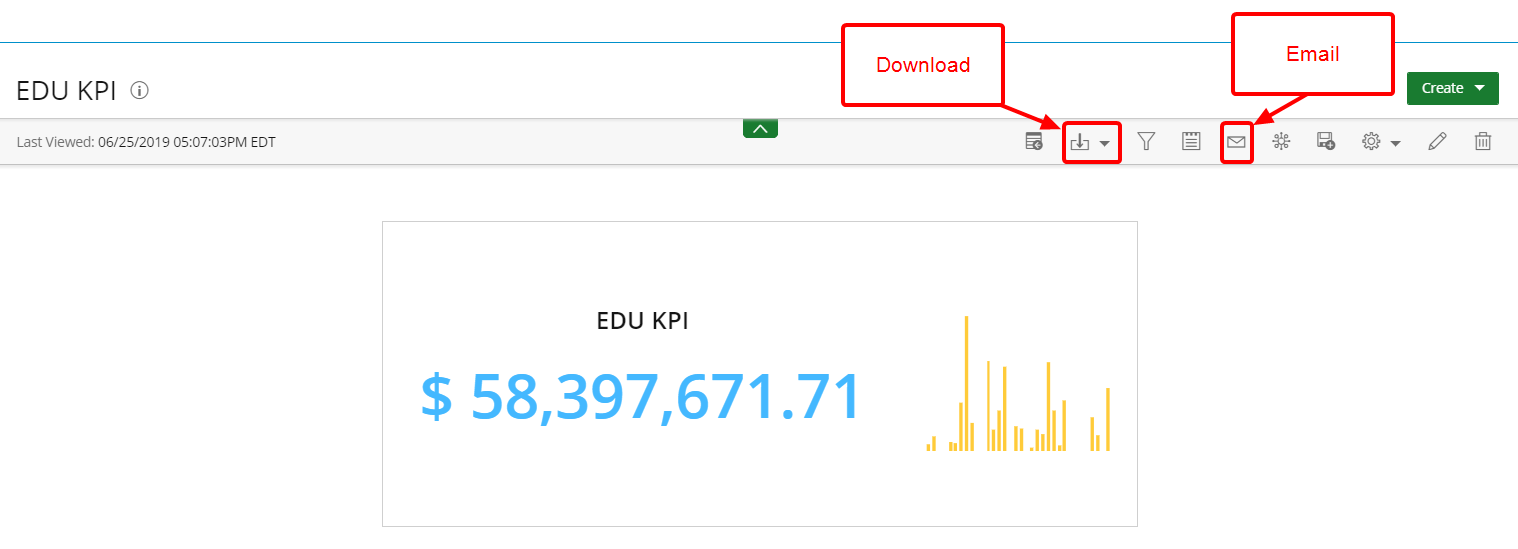
- Download: Click the drop-down arrow and select one of the following:
- Download JPG
- Download PNG
- Download PPT
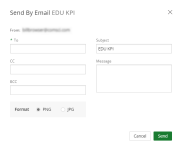
- Email: Click the icon to display the Send By Email dialog box.
- Type the recipient's email address in the To, CC or BCC field.
- Select a Format: PNG or JPG.
- Type identifying information in the Subject field.
- Type the desired message in the Message field.
- Click Send.
Note: By default, the From email address is pre-populated.
For more information on:
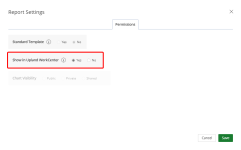
We have added a new option on the Permissions tab that allows you to display UA dashboard widgets, reports, and graphs/charts in Upland WorkCenter.
- Do one of the following to access the Permissions tab:
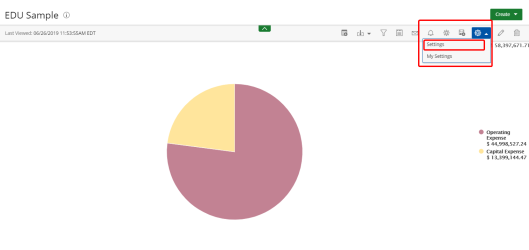
- From a report, graph or chart, click Settings from the Settings drop-down menu.
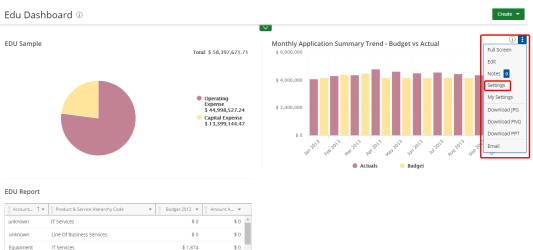
- On a dashboard widget, click the See More ellipsis and click Settings from the drop-down menu.
- Click the Permission tab.
- In the Show in Upland WorkCenter field, click Yes.
- Click Save.
Technical Tasks
Design Enhancements
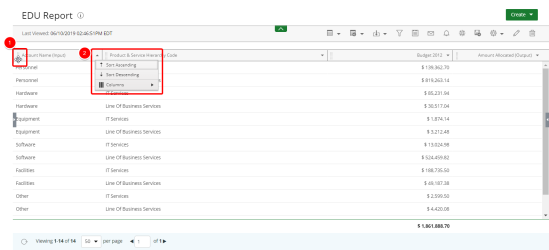
The report options have been updated to provide ease of use. You can now:
For more information, see Report Options.
The following functionality has been added when creating and editing a KPI:
- Updated Permissions Tab
- Report View
- Format
- Chart This tab displays only if you have added a chart to your layout.
- Permissions
The Permissions tab has been updated to include the Show in Upland WorkCenter option which allows you to display the KPI in the Upland WorkCenter.
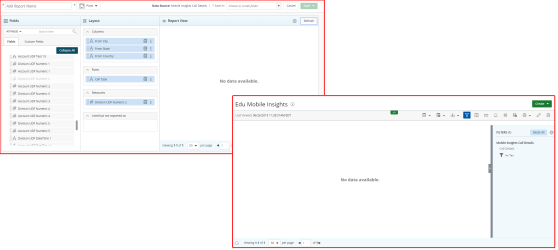
The Settings icon has been added to the Report View window to allow you to easily access the KPI settings without closing the report edit page.
The available tabs are:
Customer Requests
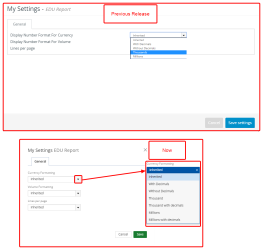
In the previous version, you could only format currency to display with or without a decimal. When numbers were in the thousands and millions, they could only be displayed two ways:
- Thousands - 100,000.00 or 100,000
- Millions - 1,000,000.00 or 1,000,000
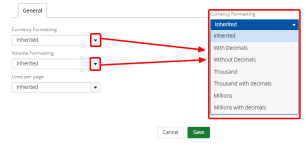
There are two new options in the Currency Formatting and Volume Formatting drop-down lists that allows thousands and millions to be shown as:
- Thousands with decimals - 100.00
- Millions with decimals - 1.00
The currency and/or volume formatting is configured on the General tab in the Settings and My Settings modal.
With this release we have made the following enhancements when exporting a dashboard:
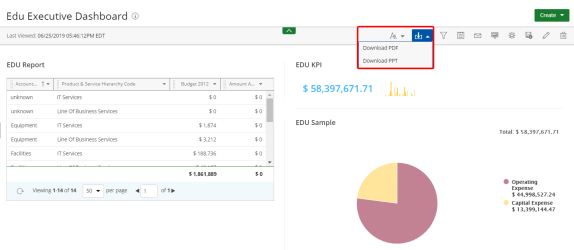
- You can now export the contents of a dashboard to a PDF.
- Click the Download drop-down arrow and select Download PDF.
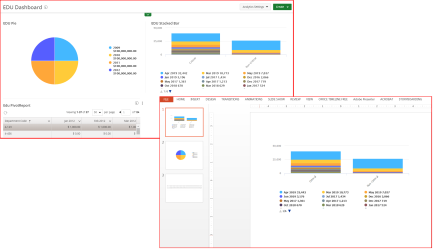
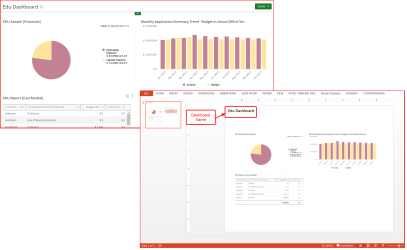
- When you export a dashboard to a PDF or PPT, the dashboard is exported as a "snapshot" displaying the dashboard name and the tab name, if there is more than one tab.
For more information, see Downloading a dashboard.
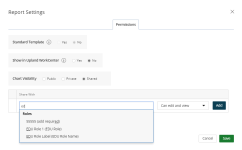
The Permissions tab has been updated to allow users to share dashboard widgets, reports, and graphs/charts with a role that contains multiple users, eliminating the need to select individual users.
See your product documentation for information on how to create a role.
In the Share With field, enter the name or label of the role that you want to share with and the role displays in the Roles drop-down menu as follows: User Role Label (User Role Name).
The icon for stack bars has been changed to  throughout UA.
