Aggregate reports are available at all levels of an account. They allow users to monitor the overall success and activity across the entire account, helping to understand their market and respond to that accordingly.
Date Range
Using the drop down you can select the time period you wish to view reporting for. This can be a fixed time period, such as 'Last Week' or 'Last 6 Months', as well as reporting for 'All Time' and a custom date range specified by you.
Note: Aggregate reports only display events from launches that occur within the time frame specified.
Summary Report
The Summary Report will display delivery statistics and launch activity, from across your account.
The key metrics it reports on are:
| Metric | Definition |
|---|---|
| Total | Total number of launches within selected area |
| Attempted | Number of email addresses that a launch was attempted for |
| Not Attempted | Number of email addresses where no launch was attempted |
| Delivered | Number of campaigns that were successfully delivered to contacts |
| Bounced | Number of campaign launches that failed (for varying reasons) |
| Blocked | Number of contacts who blocked any further launches to them |
| Opened | Number of contacts that opened your campaign (reliant on images being downloaded) |
| Clicked | Number of contacts that clicked somewhere in your campaign |
| Shared | Number of contacts who shared your campaign through social channels |
| Complained | Number of complaints that were received in direct response to your campaign |
| Unsubscribed | Number of contacts that unsubscribed from your list |
| Converted | Number of contacts that proceeded to buy something from your campaign |
Cached Reports
Note: This is an On Demand feature. If you would like more information about this feature please contact your customer success manager.
Summary reports give you the option to decide between realtime and cached reports. You can also save your choice to be remembered as the default setting.
To help improve the speed of your reports you can choose to cache them. This will mean your reports are updated every 12 hours, instead of realtime, which will help to improve load performance.
Benchmark Industries
Note: This is an On Demand feature. If you would like more information about this feature please contact your customer success manager.
You can select your industry, to see how your campaigns perform in comparison to others.
Using Tags
If you have applied tags to any of your workspaces, projects or campaigns you can use them as a filter in your account report. This can help you organise aggregate reporting across your account based on widely used tags.
Note: Multiple tags create an AND condition, and only areas that match all tags selected will be displayed
Reporting Data Viewer
Below the report is a table displaying the segmented data for each workspace, project, campaign or launches within the account. By default the table will show data by workspace, using the tabs you can switch between each.
You can access all of the available summary report, including previously bounced and previously unsubscribed statistics, using the 'Download Full CSV Report' button below the table.
For more information other reports, refer to the Campaign Report and Benchmark Reporting topics.
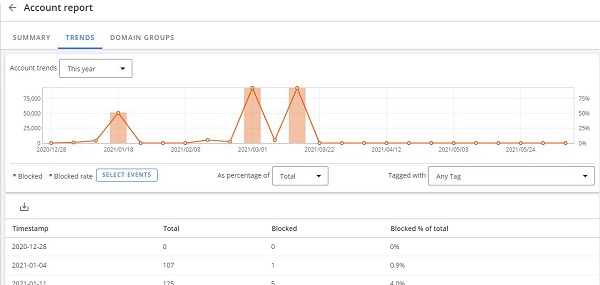
Trend Report
Trend reports give you the ability to view account trends (workspace and project included) within the platform. See your aggregated campaign data, within your given date range and use tags to report on your unique identifiers. Find outliers, both positive and negative, and get an idea of the general performance trend you're achieving.
You can also track blocked events, which occur when the email has been blocked by the recipient's spam filter.
-
To view data on blocked events, click ‘Select Events’ and choose ‘Blocked’ or ‘Blocked rate’.
Blocked events and Blocked rate are added as a line chart in the Account trends graph and as a downloadable table.
Note: The timestamps used are automatically generated to display a user friendly number of nodes for the report
Applying Metrics
Events
Click 'Select Events' and a pop-up will display the available metrics you can apply to the trendline.
Select the desired events you want to view and click save.
| Metric | Definition | Graph Type |
|---|---|---|
| Open | Displays the total number of opens | bar |
| Bounce | Total number of bounces | bar |
| Form | Total number of form submissions from campaigns | bar |
| Shared | Total number of times campaigns were shared on social media | bar |
| Unsub | Total number of unsubscribes from campaigns | bar |
| Complaint | Total number of complaints | bar |
| Click | Total number of campaign clicks | bar |
| Blocked | Total number emails blocked by spam filters | line |
| Delivered | Total number of delivered campaigns | bar |
| Conversion | Total number of times a conversion journey (or 'Sale') began from your campaigns | bar |
| Open rate | Percentage of opens against selected metric | line |
| Unsub rate | Percentage of unsubs against selected metric | line |
| Complaint rate | Percentage of complaints against selected metric | line |
| Bounce rate | Percentage of bounces against selected metric | line |
| Blocked rate | Percentage of blocked emails against selected metric | line |
| Click rate | Percentage of clicks against selected metric | line |
| Delivered rate | Percentage of delivered against selected metric | line |
| Form Rate | Percentage of form clicks against selected metric | line |
| Conversion Rate | Percentage of conversions completing from a campagin against selected metric | line |
| Shared Rate | Percentage of social media shares against selected metric | line |
Percentage Of
Decide which metric you would like your Event Rates (defined above) to be against.
For example: select Delivered, Click Rate and show as a percentage of Opens to see your CTOR, with delivered totals.
Tagging
Filter data by using the tagging system you've used across your account.
This is useful if you wish to view specific campaign trends within a project, as you can filter through using the unique campaign tag.
Viewing Metrics
Whilst the trend lines are overlayed, you can highlight specific metrics by rolling over it below the graph. Each node is a data point, which provides the data for that event.
Data Viewer
The table beneath the report will display your chosen events and event rates. This is exportable to CSV by clicking the Download button at the bottom of the data viewer.
Table columns change depending on the data selection; and timestamps will aggregate data commencing from that point, until the next timestamp.
FAQ
Why do the contact counts not add up as expected?
The contact count totals in reporting represent the total activity per contact per launch. So if you are viewing a report for more than one launch, the contact totals will cover all launches. If you launch more than once to the same list, the contacts will be counted separately for each launch.
For example, if a single contact clicked once in one launch and once in another launch, the total would be two, for two unique counts. If two contacts each clicked twice in one launch and twice in another launch, the total would still be two, once for each contact in each launch.
Why are the numbers next to my metrics in grey, rather than blue?
If the numbers are grey it means that there is no longer any data associated with it. This is likely due to your data retention period.