Build flow to serve a PDF preview
This topic continues the tutorial on how to Serve a PDF preview, with detailed steps to create the flow.
Create the HTTP endpoint
In OL Connect Automate, every HTTP endpoint begins with an http in node and ends with an http response node. The http in node listens for incoming HTTP requests, and the http response node sends a reply. In this step, you'll create a minimal HTTP endpoint to verify that your environment is set up correctly. We'll use a browser to trigger the endpoint and confirm that it's working.
Open OL Connect Automate
Launch your browser and navigate to the Node-RED editor. By default, it's available at:
http://localhost:1880/
Add nodes
-
From the palette, drag an http in node onto the canvas.
-
Click and drag the output port of the http in node to the right.
-
In the pop-up search, type
httpand select http response.
This inserts and automatically links an http response node to your http in node.
Configure the http in node
-
Double-click the http in node to open the Properties panel.
-
Ensure the Method is set to GET (this is the default).
-
Set the URL field to /certificate.
This registers the endpoint at: http://localhost:1880/certificate
Deploy and test
-
Click Deploy, in the upper right, to activate the flow.
-
Open a new browser tab and go to:
http://localhost:1880/certificate
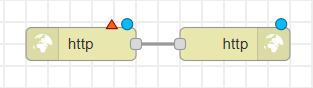
Since the flow doesn't include any tasks yet, it will return an empty JSON object, {}, by default.
![Initial flow with two nodes, labelled [get]certificate and http.](../../Resources/Images/tutorial/pdf-preview-test-25-1.png)
Send data to the endpoint
Next, we'll send data to the endpoint using query parameters. This data will be used in later steps to personalize the OL Connect template.
Add query parameters via the browser
To pass data to the flow, add parameters to the URL in your browser:
-
Append
?name=Peter Parkerto the endpoint URL. -
Then, add a second parameter using
&course=OL Connect Automate
The final URL should look like this:
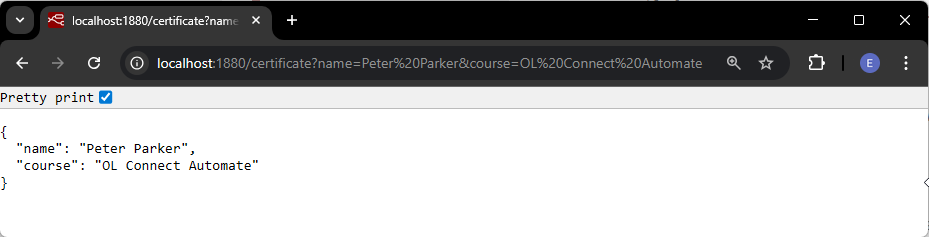
http://localhost:1880/certificate?name=Peter Parker&course=OL Connect Automate
This sends two query parameters: name and course to the flow.
View the response
Press Enter in the browser's address bar to call the endpoint. The response displays a JSON object containing the query parameters:
{
    "name": "Peter Parker",
    "course": "OL Connect Automate"
}
At this point, your flow is capturing incoming parameters, and the http response node is returning them as JSON, confirming that the endpoint is working and ready for the next steps.
Debug the incoming data
Before we add additional logic to the flow, let’s explore how to inspect incoming data within the Node-RED editor. This will help you verify that query parameters are being passed correctly.
Add a Debug node to the flow
-
Switch back to the browser tab with the OL Connect Automate editor,
http://localhost:1880/. -
Click and drag the output port of the http in node to the right.
-
In the node search that appears, type
debugand select the debug node.
This inserts and automatically connects a debug node to the http in node.
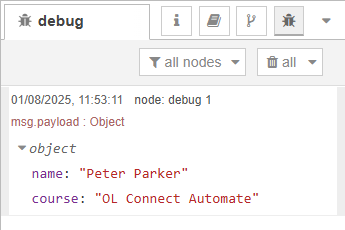
![Flow with a debug node added, linked from the http in ([get] certificate) node.](../../Resources/Images/tutorial/pdf-preview-add-debug-25-1.png)
The debug node outputs the message object it receives to the Debug panel, allowing you to inspect it in real time. To view the panel, click the menu at the right end of the title bar, and select View > Debug messages
How the data flows
Node-RED uses messages (JavaScript objects called msg) to pass information between nodes.When using the http in node with the GET method, the query parameters sent in the URL are included in msg.payload as key-value pairs.
In this example, calling:
http://localhost:1880/certificate?name=Peter Parker&course=OL Connect Automate
Results in a msg.payload that looks like:
{
    "name": "Peter Parker",
    "course": "OL Connect Automate"
}
Trigger the flow and inspect the output
Return to the browser tab where you entered the URL.
Refresh the page to re-trigger the flow.
Switch back to the editor and view the Debug panel. You will see the incoming data displayed in the panel, confirming that the query parameters are received as expected.
Now continue to Add template to serve a PDF preview.