Debug current file
You can inspect and debug the information of the file captured by the folder capture node, using the debug node.
See Trigger flow with a folder capture node for instructions on setting up a watched folder. That is the first step for this flow.
Within the debug node’s Properties, choose one of the following output options:
-
msg.filenameormsg.payload– Will display the full file path. -
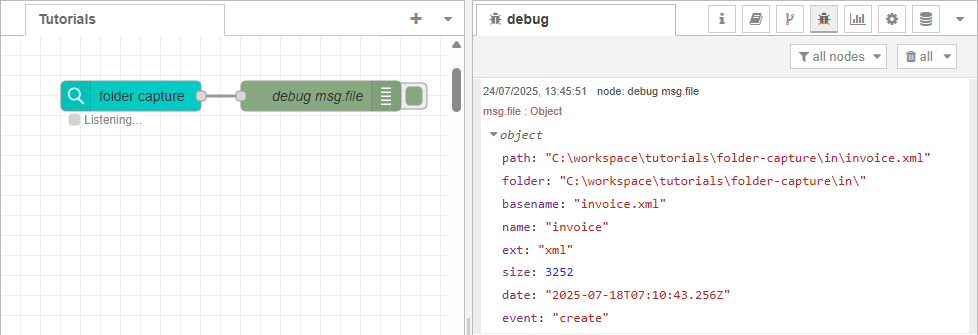
msg.file– Will display the file metadata (name, extension, folder, etc.). -
complete msg object – Will display all available properties in the message.
After deploying the flow, the selected output appears in the Debug panel, allowing you to verify the captured data. To view the Debug panel, click the menu at the right end of the title bar, and select View > Debug messages
Next use case: Apply conditions from file metadata