Goal Indicators
Measure Templates with Goal Indicators evaluate Measure values based on their progress toward a specific target (a.k.a. the Target Value). When these Measures are attached to work items, they will produce data visualizations that track how closely the values are progressing toward reaching the Target Value on the Target Date.
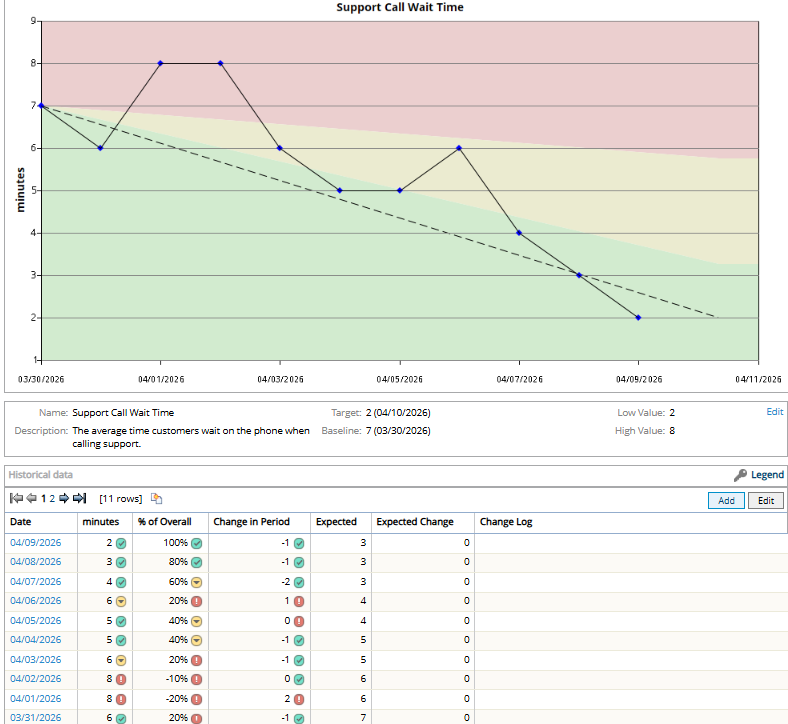
This data visualization graph tracks progress towards a goal of lower average wait times when customers call support.
The graph displays a dotted line that directly connects the first Measure value with the Target Value. Additionally, it features a red zone, a yellow zone, and a green zone as background colors. These colors indicate whether the Measure values are on the right track to reach the Target Value by the Target Date; values that are close to the dotted line are more likely to fall in the green zone (good) while vales that are not very close are more likely to fall within the yellow or red zones (needs improvement).
The thresholds determine how much space each color takes up on the chart. Both of these percentages are based on progress toward the goal, not a static value.
Example: This Measure has a Target Value of 2 minutes and a Target Date of April 10th. It has been set up with a red/yellow threshold of 25% and a yellow/green threshold of 75%.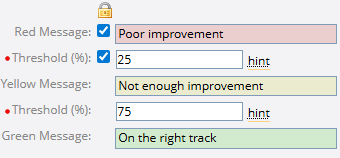
This means that a dotted line will directly connect the first Measure value with the Target Value on the Target Date. It also means that the red zone will cover the area of the graph that represents less than 25% improvement toward the dotted line, the yellow zone will cover the area that represents less than 75% improvement, and the green zone will cover the area that represents over 75% improvement.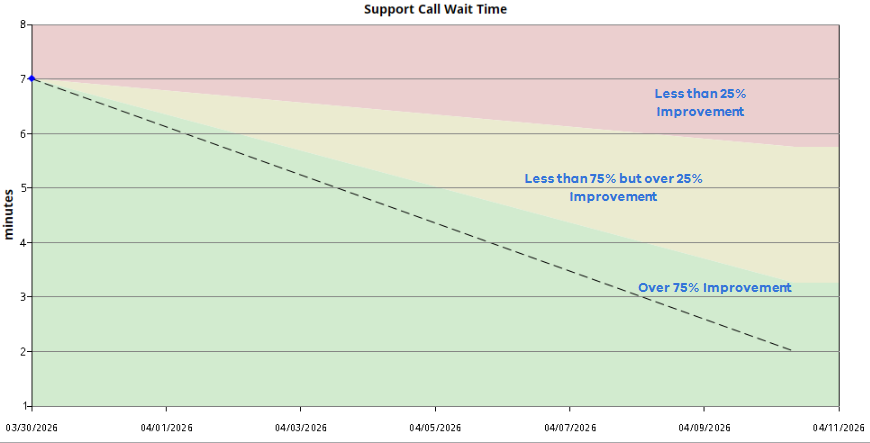
Think of the dotted line as a representation of being 100% on track to reach the goal. The end of the green zone represents 75% of the way to the dotted line.
Tip: The data visualizations from Measures can be saved as PowerSteering Charts, which can then be attached to Dashboard Layouts.
Example: Santi has implemented a few solutions in an attempt to reduce the time customers have to wait on hold when they call his business. To see if these efforts have been working, he creates a new "Support Call Wait Time" Measure and adds it to his Project. He instructs his Head Secretary to enter the average wait time of all customer calls into the Measure as a value every day.
He would ideally like to reduce the wait times to an average of 2 minutes per call by the end of the Project, so he configures the settings around his goal of 2 minutes under the "Goal Indicator" section of the Measure Template. 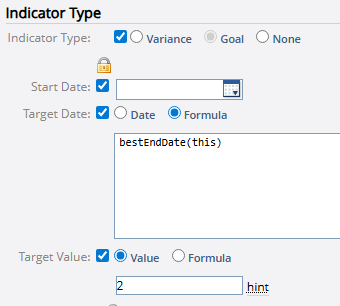
He also defines thresholds that indicate whether the Measure values are on track to reach his goal of 2 minutes by the Target Date.
Once the Measure is attached to his Project, he can track the average wait times per day and see if he is on track to meet his goal.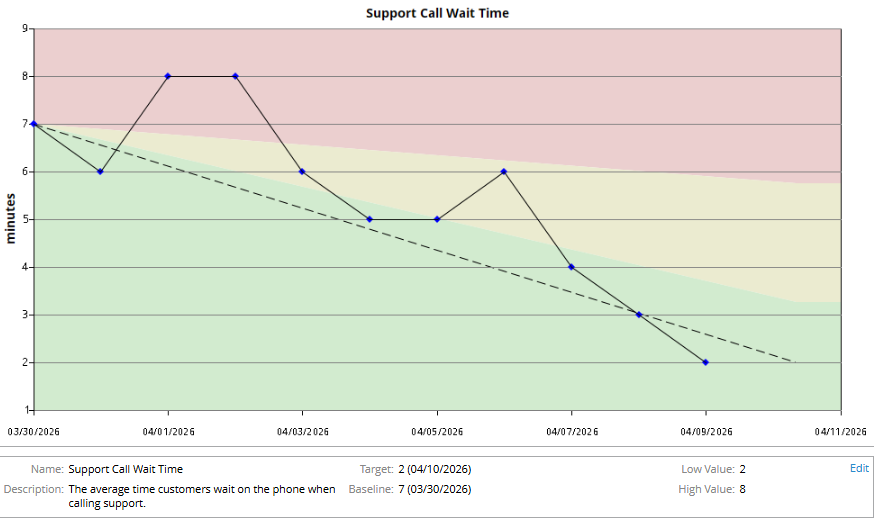
Goal Indicator settings for Measure Templates
Note: If you are attempting configure Goal Indicator settings for a new Measure, you must first follow Steps 1-7 from Add a New Measure Template. Whether you are creating a new Measure Template or editing an existing one, you must have the "Measure Template" Context permission.
-
Locks: Notice the Lock icons
 with checkboxes directly below them. When the checkbox next to a field is selected, that field is considered locked. Any changes made to locked fields will be applied to all Measure instances that have been attached to PowerSteering work items. Changes made to unlocked fields will not be applied to existing Measures; they will only be applied to new Measure instances that are attached to work items going forward.
Note: The checkbox next to the "Red Message" field controls all three messages: Red, Yellow, and Green. Similarly, the checkbox next to the first "Threshold (%)" field controls both thresholds.
Tip: Selecting a Lock icon
will automatically select/deselect all of the checkboxes directly below it. -
Start Date: Use the date picker
 to select the date you would like the Measure to begin capturing data.
Note: The earliest value captured after the Start Date will serve as the Measure’s Baseline.
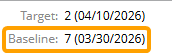
Based on this information, PowerSteering automatically calculates what the expected values are for each period between the Start Date and the Target date and assumes a linear trend from the Baseline to the Target Value.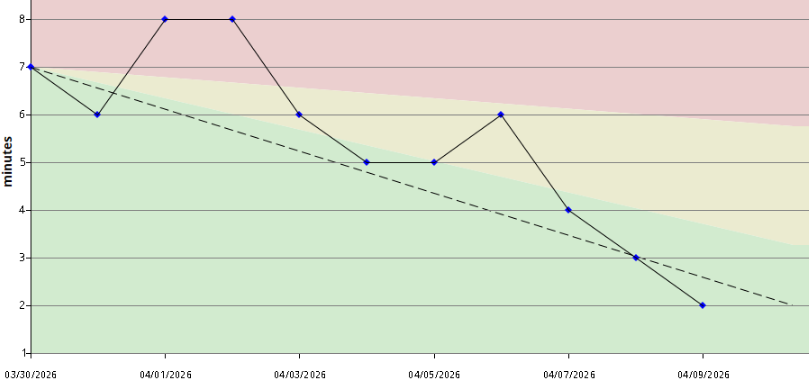
The dotted line represents linear progress toward the goal from the Start Date (03/30/2026) to the Target Date (04/09/2026). -
Target Date: The date you would like to reach your Target Value (a.k.a. your goal).
Select one of the two options for capturing a Target Date:
-
Date: Use the date picker
to select a Target Date for every work item the Measure is attached to. -
Formula: Use the Formula Builder to create a formula that will automatically calculate a date.
Tip: Formulas can be used to generate dynamic Target Dates that adapt to the unique characteristics of each work item. For example, entering "bestEndDate(this)" ensures that the Target Date is always the End Date of the work item the Measure is attached to.
-
-
Target Value: The goal value you would like to achieve by the Target Date.
Select one of the two options for capturing a Target Value:
-
Value: Enter a value that will serve as the Target Value for every work item the Measure is attached to.
Note: If "Date" is selected as the Display Format, use the date picker
to select a date that will serve as the Target Value. -
Formula: Use the Formula Builder to create a formula that will automatically calculate a value.
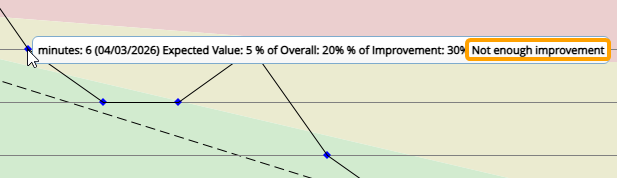
Tip: Formulas can be used to generate dynamic values that adapt to the unique characteristics of each work item. For example, imagine a Custom Field called "Average Wait Time Goal" has been attached to all Projects.
Entering "fieldNumber(this, @Field[Project > Average Wait Time Goal])" will pull the value from this field, ensuring that each Project uses its own unique goal as the Target Value.
-
-
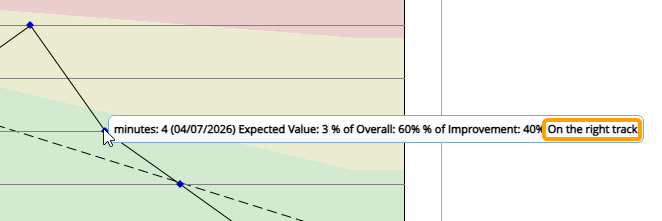
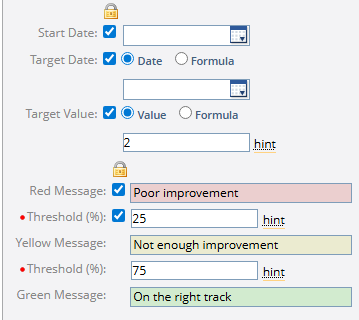
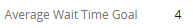
Red Message: The text that appears when the Measure value is in the red zone (a.k.a. when it is considered too far from the goal). This message can be seen when users hover the cursor over a Measure value in the red zone.
-
Threshold % (between red and yellow): This percentage determines the end of the red zone. Measure values that cannot reach this expected percentage of the goal for the given date will belong to the red zone.
-
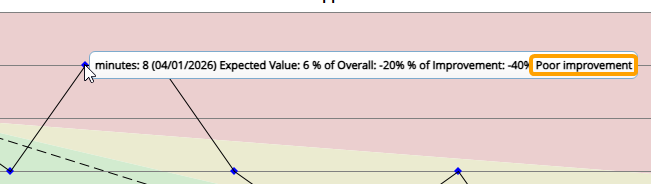
Yellow Message: The text that appears when the Measure value is in the yellow zone (a.k.a. when it is considered not close enough to the goal). This message can be seen when users hover the cursor over a Measure value in the yellow zone.
-
Threshold % (between yellow and green): This percentage determines the end of the yellow zone. Measure values that cannot reach this expected percentage of the goal for the given date will belong to the yellow zone.
-
Green Message: The text that appears when the Measure value is in the green zone (a.k.a. when it is considered on track to reach the goal). This message can be seen when users hover the cursor over a Measure value in the green zone.