Reporting
There are four ways to gather information on activity in Upland Qvidian: event audits, Structured Query Language (SQL) reports, Upland Analytics, and library reports. Event audit reports display in a grid that lists details and can be exported in a Microsoft Excel spreadsheet. Analytics reports can be displayed in and exported to a variety of formats. Event audit reports can include more events than standard Analytics reports, which means they can show a larger variety of information, but Analytics is more visual. Both rely on auditing events for their data. SQL reports, which also display in a grid and can be exported to Excel, can be created to query any information in the tables within your Upland Qvidian database. While SQL queries can be more customizable, they may require knowledge of SQL or additional assistance to create, and do not offer the visual representation of data that Analytics offers. Library reports, which are created when you export library search results to an excel spreadsheet, can contain any information you choose to show in the library search panel grid and can be useful for identifying content that has not been modified or used recently, as well a duplicate titles.
Tip: The "Create a list for Excel" extract content records option is considered a best practice when creating a Library Report. Both standard properties and custom metadata fields are available to add to the grid when creating a Library Report.
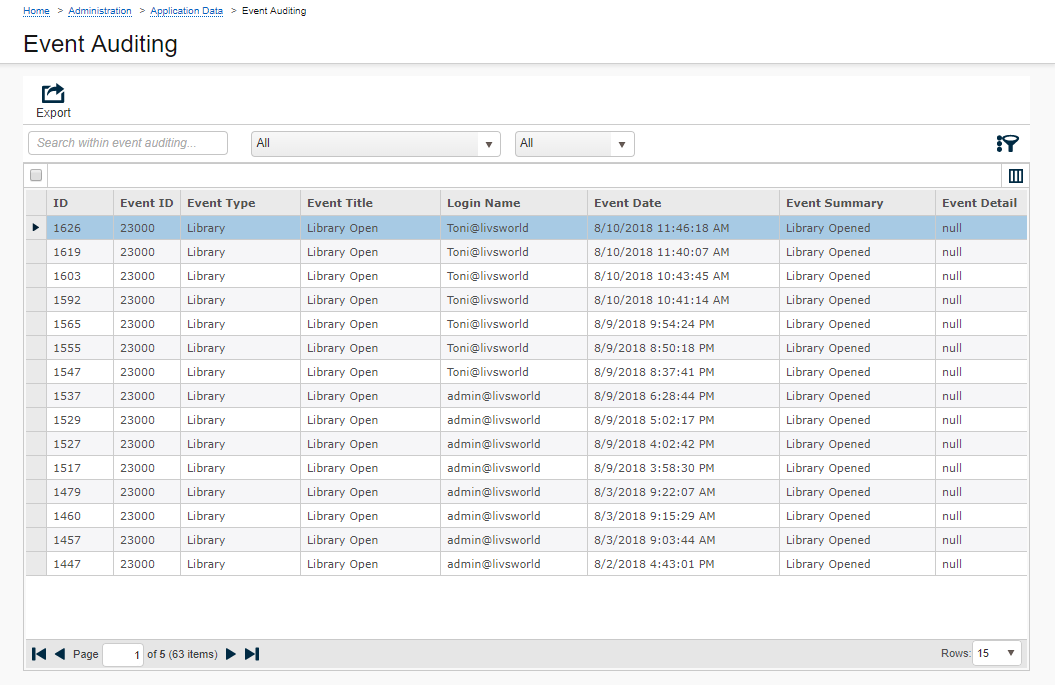
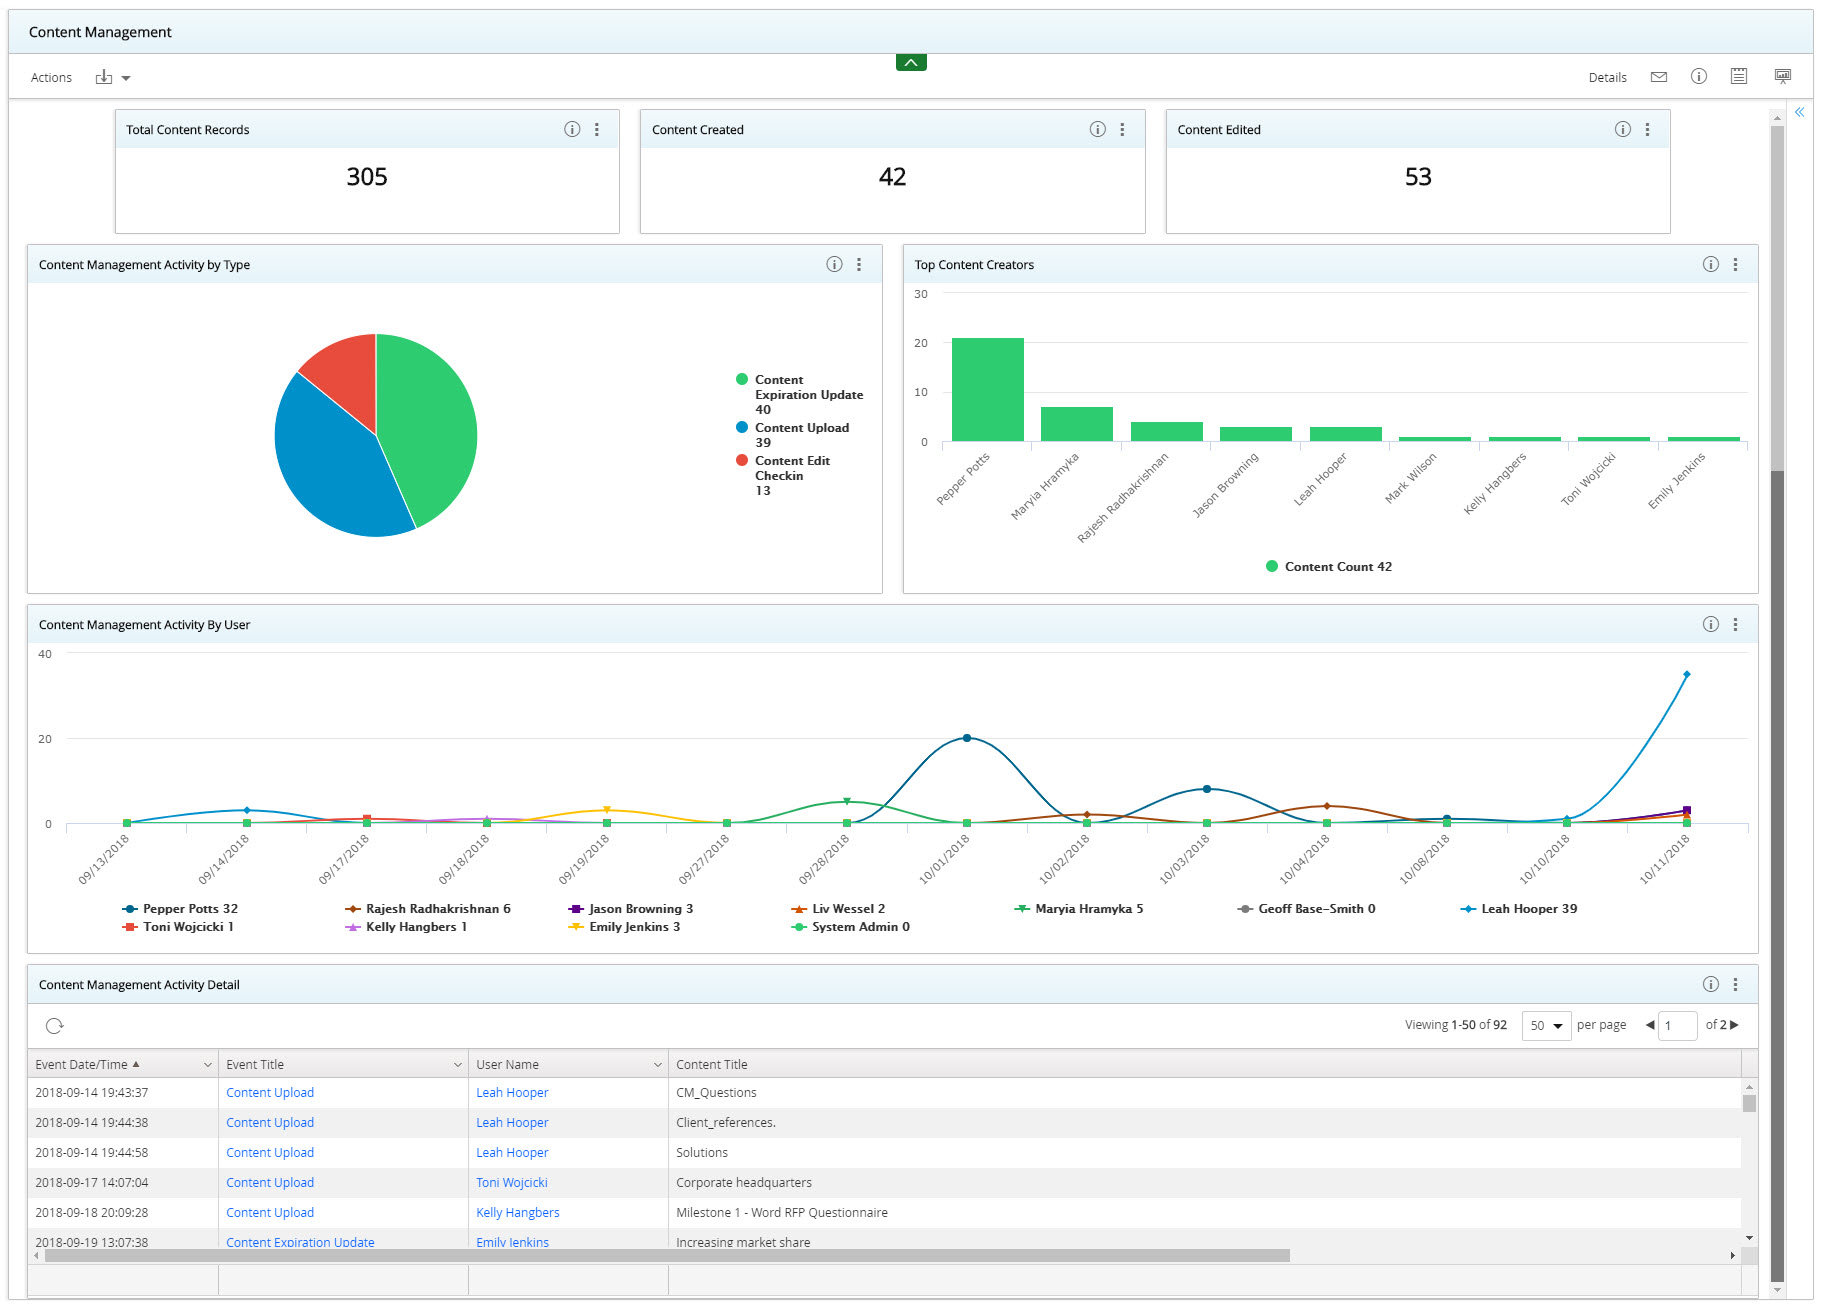
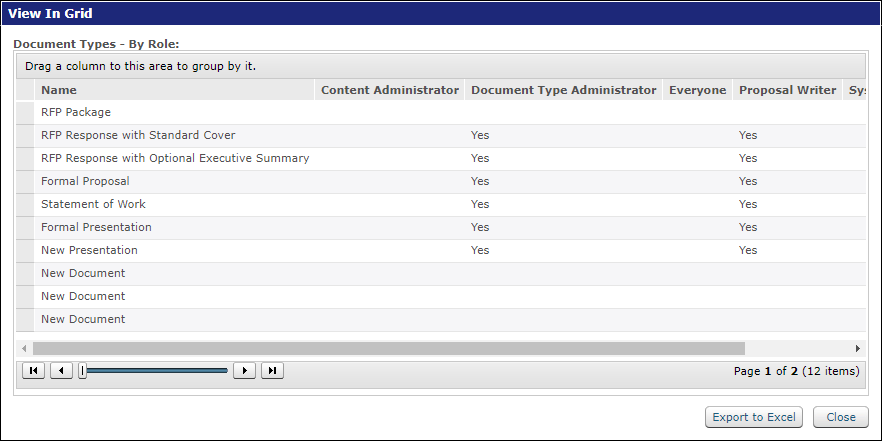
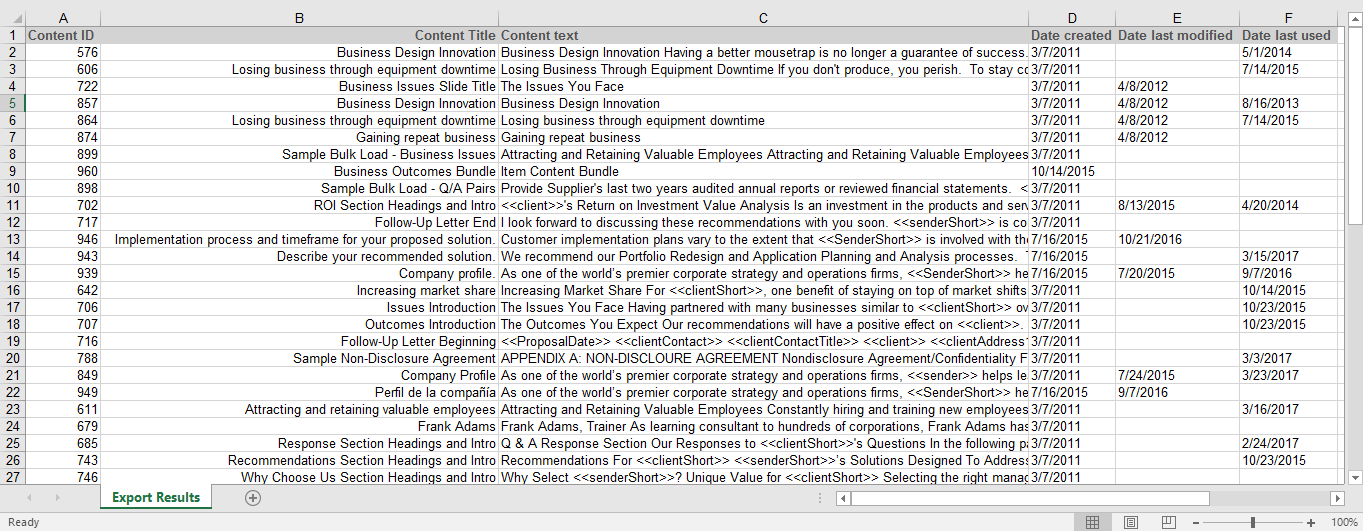
Example of reports (from left to right): an auditing event report on the Event Auditing page, Content Management dashboard in the Analytics Standard Dashboards collection, a SQL report in a grid, and a library report in Excel. Click to enlarge.