Create a Stacked-Bar Graph
A Stacked-Bar Graph is a variant of the Bar Graph. A standard bar chart compares individual data points with each other. A Stacked-Bar Graph (or stacked-bar chart) is a chart that uses bars to show comparisons between categories of data, but with the ability to break down and compare parts of a whole. Each bar in the chart represents a whole, and segments in the chart represent different parts or categories of that whole.
1. Create Report
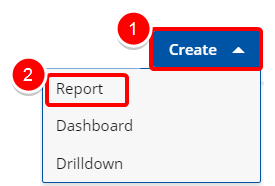
Access the Create Report modal by:
- Click the Create button on the Main Menu Bar.
- Then select Report from the menu.
2. Select your Data Source
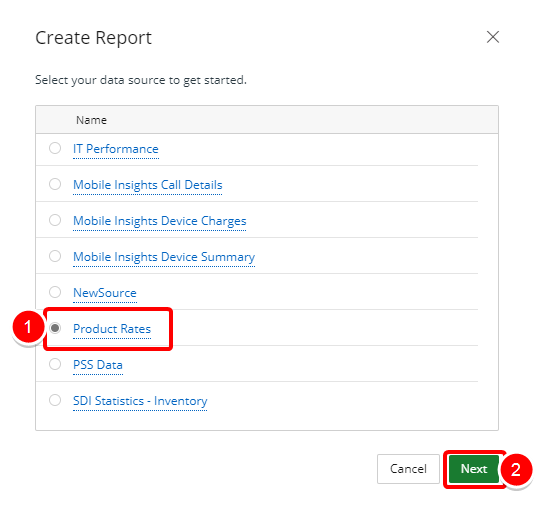
- Select your data source from the list of available data sources to get started.
- Click Next to continue.
3. Add a Report Title
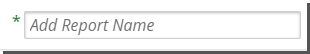
- Click on the Add report name box and type the name of your report.
4. Select a Report Type
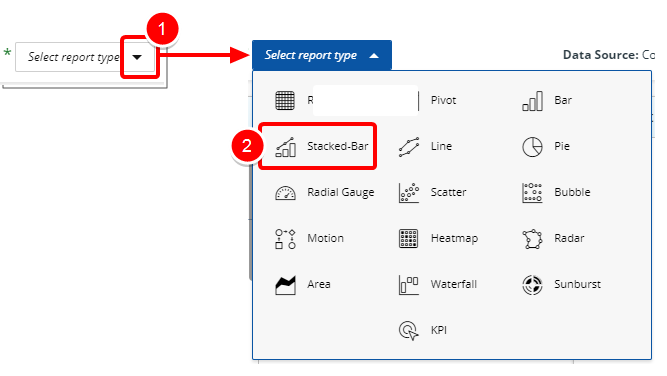
- Click the arrow button next to Select report type.
- Select Stacked-Bar from the list of available report types to get started.
5. Select a Folder
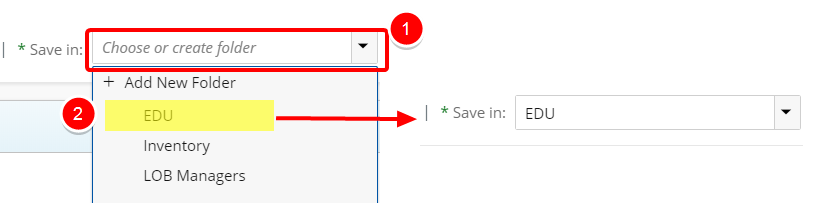
- Click the Save In arrow to view and select an available folder where your graph will be saved.
- Do one of the following to make your selection:
- Choose or create folder: Enter values in this box to filter and find the folder where your graph will be saved.
- Click the arrow and select Add New Folder to create a new folder where your graph will be saved. See Create a Folder below.
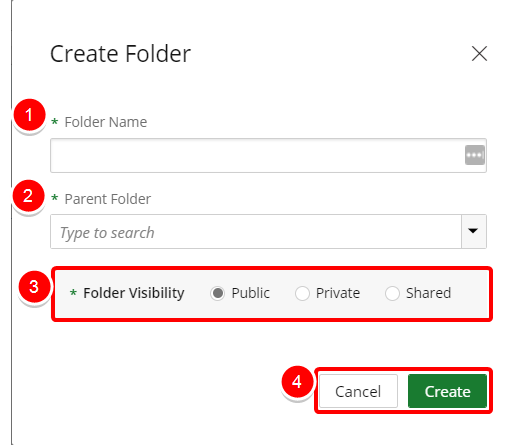
- In the Folder Name box, type your new folder name.
- Select the desired Parent Folder from the list.
- Select your Folder Visibility:
- Public: By default, this option is selected. This option allows your folder to be viewed by all users.
- Private: This option will allow you to hide your folder from other users.
- Share: This option allows you to set your folder to be viewed by specific user(s).
- Click Create to create your new folder or Cancel to return to the previous page.
6. Filter or Search for Data Fields
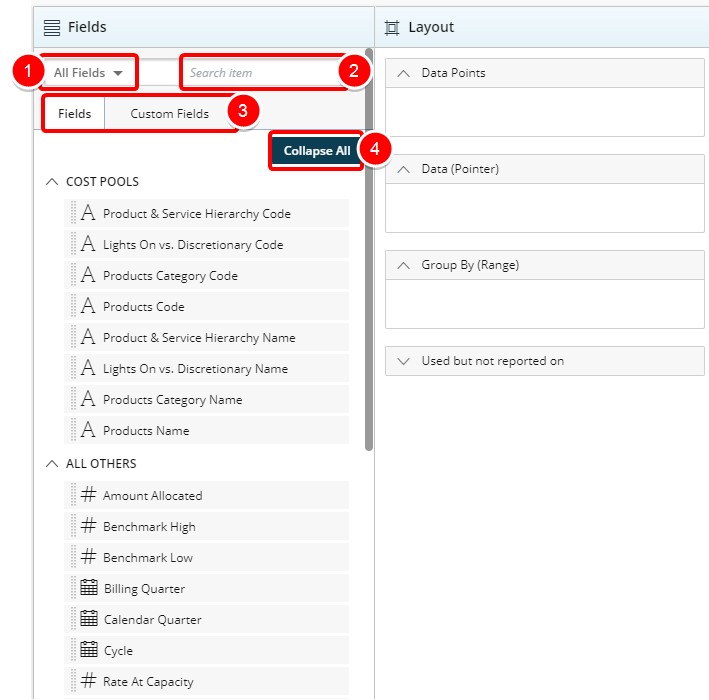
- Select the desired Filter to apply to the list of available Fields. The available options are:
- All Fields
- Dimensions
- Measures
- Date
- Start typing in the Search item box to begin searching for available Fields.
- You can alternate between Fields and Custom Fields by clicking on either one of the tabs. Tip: For more information on how to create and use Custom Fields please refer to: Create and Use Custom Fields
- Click Expand All or Collapse All to view or hide all available options in order to easily narrow down on the desired field(s).
7. Select your Data Field(s)
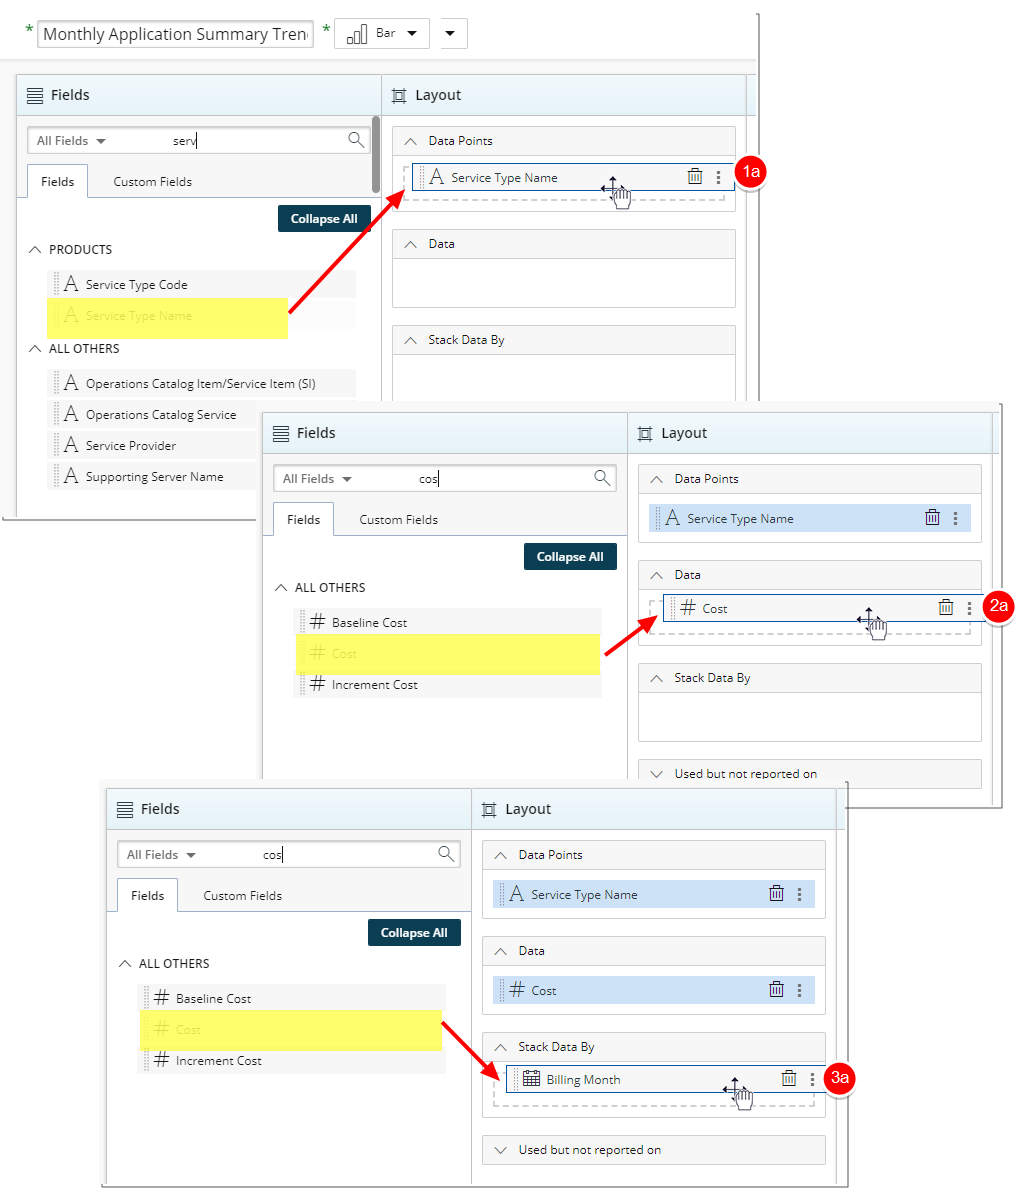
- The Data Points section defines the X-Axis Data Set in your Graph. Drop one non-numeric Field to define the main category on the X-Axis (horizontally).
- The Data section defines the X-Axis Data Set in your Graph. Drop one numeric Field as the subdivision on each column (X-Axis).
- The Stack Data by section defines the s Y-Axis Data Set. Drop one numeric Field or Date Field, to define the value range on the Y-Axis (vertically).
8. Add a Filter (Optional)
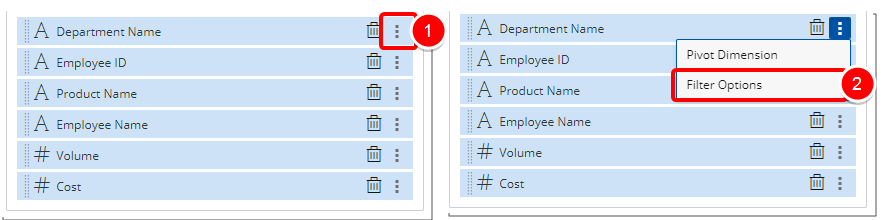
- Click the Ellipsis button of a Field added to Data Points, Data or Group By sections.
- Select Filter Options from the context menu.
9. Add a Pivot (Optional)
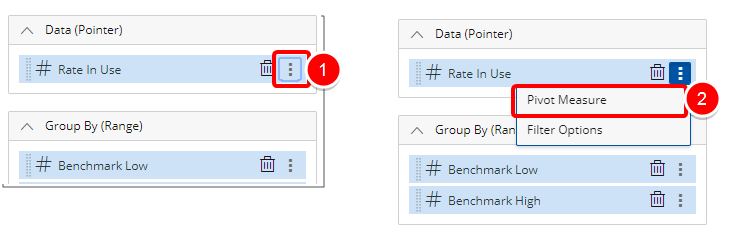
- Click the Ellipsis button of the Field(s) added.
- Select Pivot Measure from the context menu.
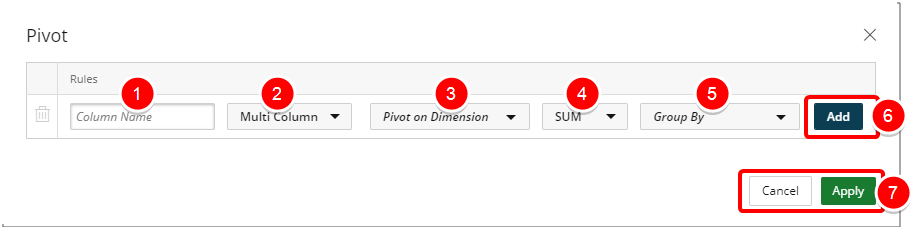
- Begin typing the Alias name of your column in the Column Name box .
- Select one of the following:
- Multi Column: By default, Multi Column is selected. Presents your pivot value within multiple columns.
- Single Column: Presents your pivot value in one column.
- Click or type the desired Pivot on Dimension.
- Click or type the desired measure.
- Click or type the desired Group By.
- Click the Add button to add a new Pivot option.
- Click Apply to save your changes and return to the previous page. Alternately you can Cancel your changes and return to previous page.
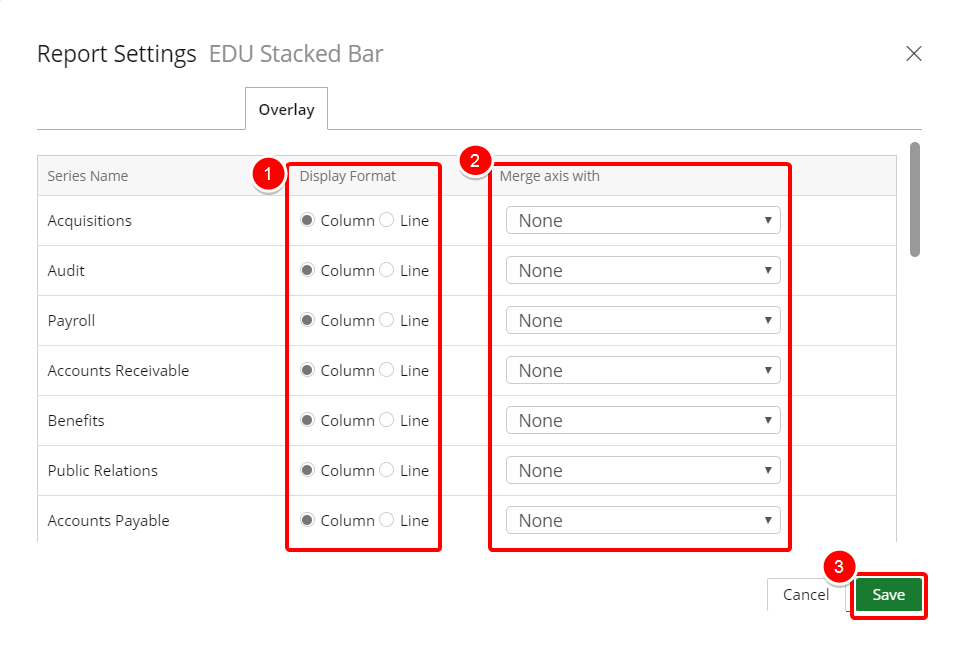
10. Add an Overlay (optional)
You can change the overlay of your stacked-bar graph from columns to lines and display columns and lines all on one graph.
- Click the Settings button on the Main Menu Bar.
- Select Settings from the menu.
- Click the Overlay tab.
- In the Display Format column, select Line for the series that you want to display as a line.
- Click the arrow in the Merge axis with column for the series that you want to merge and select a series to merge with from the available options. This functionality is useful when data is shown on two of the same axis.
- Click Save.
11. Preview Report
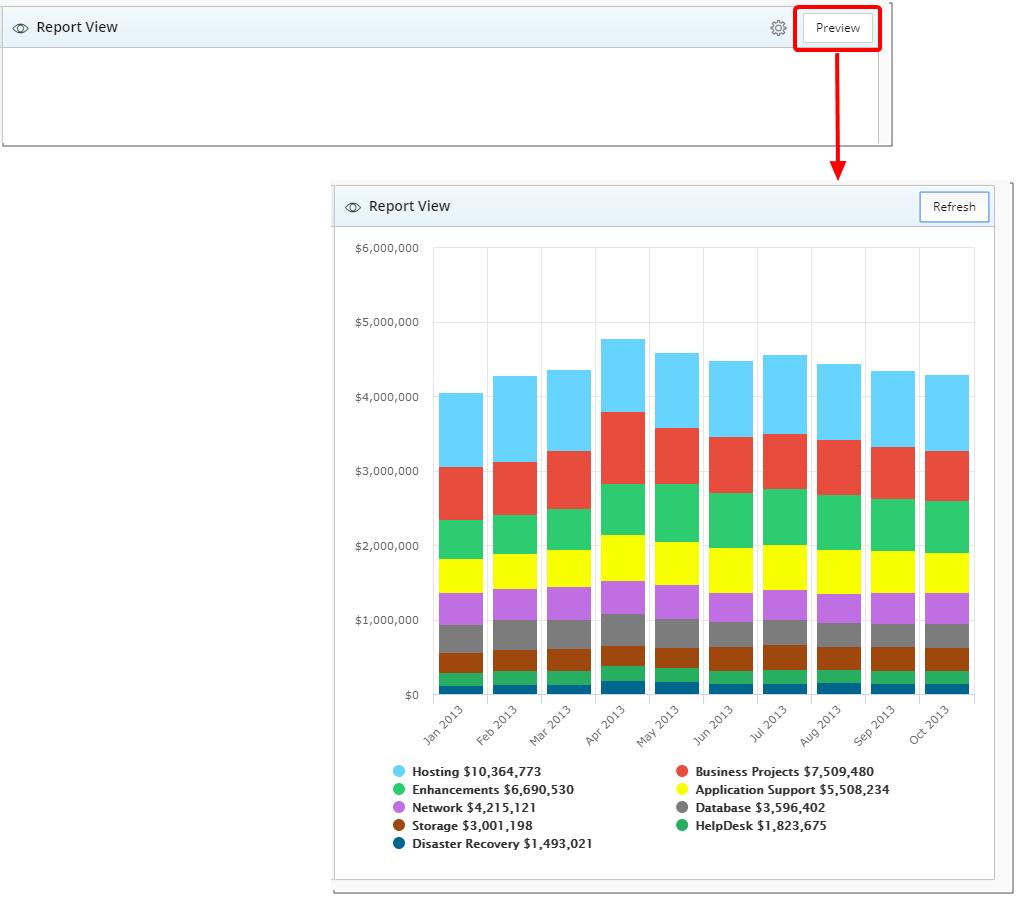
- Click the Preview button to preview your report.
12. Save Report
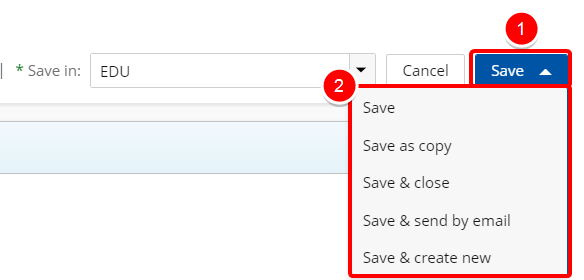
- Click Save to open the Save context menu
- Choose one of the available Save options:
- Save: Selecting this option will save the report without exiting the report edit page.
- Save as copy: Selecting this option will save a copy of the report. You will need to rename the report in the Navigation Menu.
- Save & Close: Selecting this option will save the report and close the report edit page. The report will then run.
- Save & send by email: Selecting this option will save the report and close the report edit page. A modal window will then give you the options to send the report. For more information refer to Email a Graph/Chart.
- Save & Create new: Selecting this option will save the report and close the report edit page giving you the option to create a new report.
Menu