This topic contains information about what’s new and resolved as of Upland Analytics 2018 R1.5.
Stories
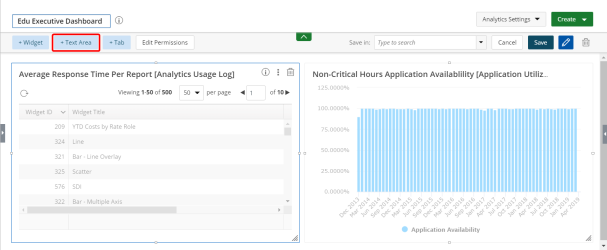
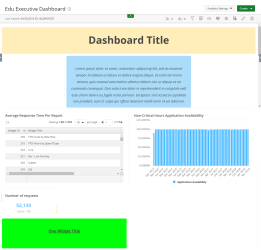
The Text Area button has been added to the Main Menu Bar when editing a Dashboard to allow users to add a title or description to areas on the Dashboard.
For more information, see Adding a Text Area to a Dashboard.
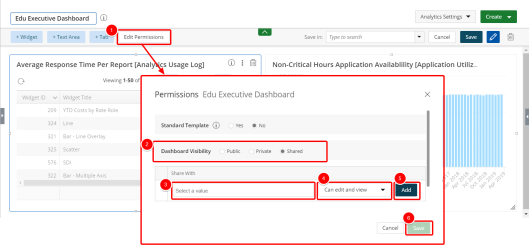
Users now have the ability to add edit permissions when sharing their reports, graphs/charts, and dashboards with other users.
Reports/Graphs/Charts
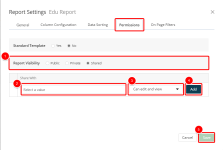
The Permissions tab has been updated to allow the user to select the permissions for each user when sharing a Report and/or Graph/Chart.
- In the Report Visibility section, click Shared.
- Click the Select a value field and select the user(s) to share your report/Graph/Chart with.
- Click the arrow and select the permission for each user. The available options are:
- Can edit and view- the default
- Can view
- Click Add.
- Click Save.
Dashboards
- Click the Edit Permissions button on the Edit Menu Bar.
- In the Dashboard Visibility section, click Shared.
- Click the Select a value field and select the user(s) to share your dashboard with.
- Click the arrow and select the permission for each user. The available options are:
- Can edit and view - the default
- Can view
- Click Add.
- Click Save.
Technical Task
Design Enhancements
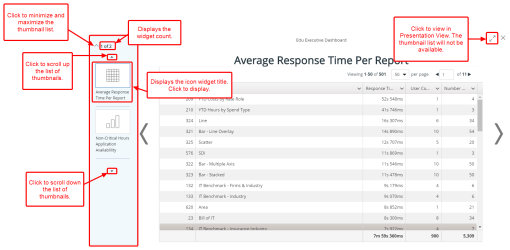
In Presentation mode, when the view is not expanded (not presentation view), a thumbnail list is present on the left displaying a report type icon and the widget's title for all of the widgets on the dashboard.
When there is a large number of widgets on the dashboard, users can scroll through the thumbnail list and select the widget to view. Users can also scroll through the widgets on the dashboard using the Previous and Next arrows.
For more information, see Presentation Mode.
Edit Dashboard View
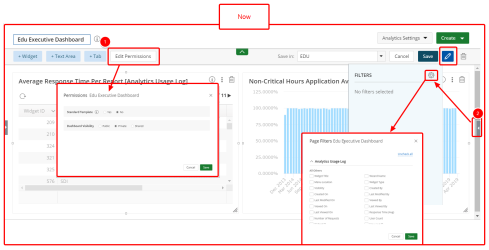
The edit functionality for a dashboard has been moved to the Edit Dashboard view.
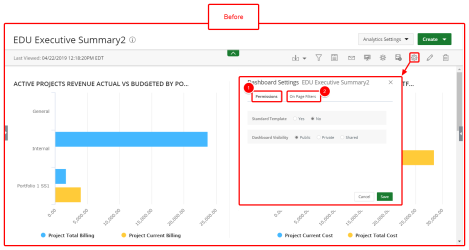
Specifically, in the previous version, users accessed the Permissions and On-Page Filters tabs by clicking the Settings button on the Main Menu Bar.
With this release, the Settings button has been moved and all edit functionality is accessed by clicking the Edit button on the Main Menu Bar. Some of the available edit options include:
- Edit Permissions: Click this button to access the Permissions tab.
- Click the arrow to open the Filter Drawer and then click the Settings button to access the On-Page Filters tab.
Add Widget Functionality
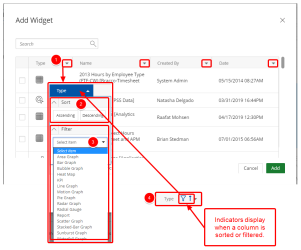
Users can now easily sort and filter the columns in the Add Widget modal to quickly find a widget.
- Click the arrow button next to the desired column.
- Select Ascending or Descending to sort the column.
- Click the arrow button next to Select item and select the item to filter by.
- An icon displays when the column is sorted and/or filtered.
For more information, see Creating a New Dashboard.
Customer Requests
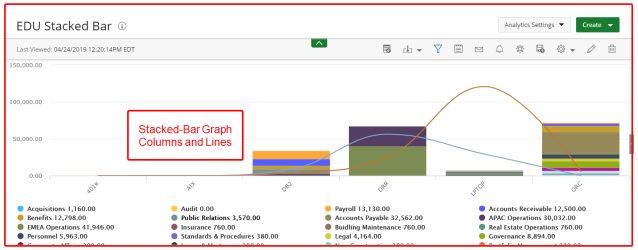
Users are now able to change the overlay on stacked-bar graphs from columns to lines and display columns and lines all on one graph.
To access the new functionality:
- Click the Settings button on the Main Menu Bar.
- Select Settings from the menu.
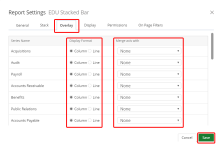
- Click the Overlay tab.
- In the Display Format column, select Line for the series that you want to display as a line.
- Click the arrow in the Merge axis with column for the series that you want to merge and select a series to merge with from the available options. This functionality is useful when data is shown on two of the same axis.
- Click Save.
For more information, see Creating a Stacked-Bar Graph.
Resolved Issue
Fixed an issue in the Dashboard Presentation Mode where the sequence of the widgets displayed in the in modal view did not match the order of display in the dashboard; left to right and top to bottom.
