This topic contains information about what’s new and resolved as of Upland Analytics 2020 R1.0.
Stories
All fields are available in the auto complete drop-down menu for formulas and functions when users build a custom field.
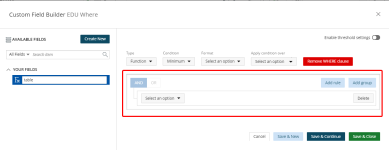
UA has been enhanced to allow users to create WHERE Functions Custom Fields. For example, users can now create the following custom field:
- ContentCount WHERE (UserRole = ('Content Manager' OR 'RFP Writer') AND (DateCreated < 'CURRENT')
Users can also create multiple custom fields with the same fields. For example, another custom field similar to one above:
- ContentCount WHERE (UserRole = ('Content Manager' OR 'RFP Writer') AND (DateCreated >= 'CURRENT')
For more information see Create or Edit a Function.
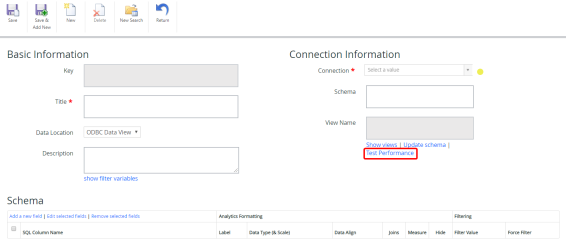
When creating a new view, you are now able to test the view's performance in edit mode.
Click Test Performance. The following test results display:
- View Name
- Total number of rows
- Response time for 50, 100, and 1000 rows
For more information see Create a View.
The following message displays when a report takes too long to render:

Click one of the following:
|
|
|
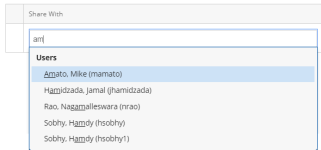
Administrators are now able to delete a user from the User Role list.
For more information see your product documentation.
Customer Requests
UA has been enhanced to support the following date and time formats:
- Date
- Day / Month / Year
- Year / Month / Day
- Time
- 24 hour
- 24 hour with seconds
- 12 hour
- 12 hour with seconds
For more information see your product documentation.
The pivoted field description no longer displays when there is only one pivoted data point.
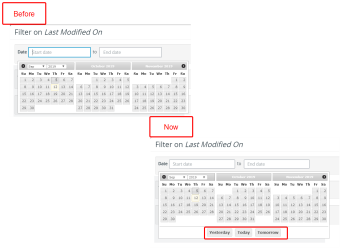
UA now allows users to select open ended dates when using On-Page Filters.
Click the Date fields and then click Yesterday, Today, or Tomorrow.
For more information see Apply an On-Page Filters or Apply an On-Page - Dashboard.
When viewing dashboards in presentation mode, users can now change the font size of reports and graphs (not available for KPIs and Radial Gauge Graphs).
For more information see Presentation Mode.
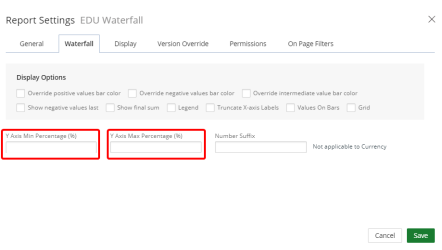
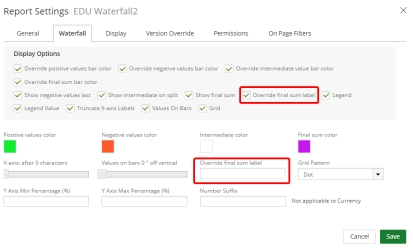
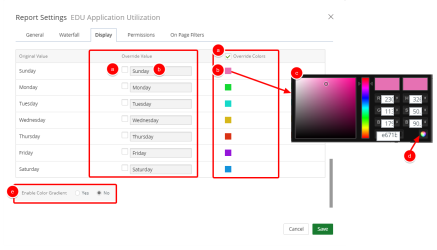
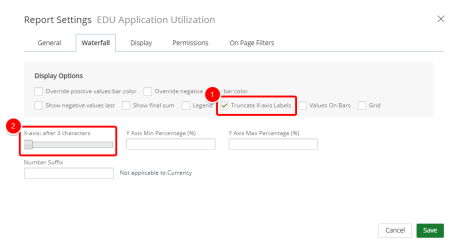
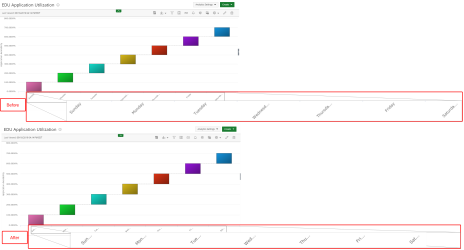
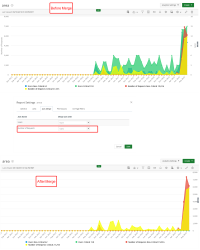
The Display tab has been added to the Waterfall settings to allow users to change the text and color of the individual bar on the Waterfall chart.
- To change the text, in the Override Value column, do the following:
- Click the checkbox next to the bar that you want to rename.
- Type the desired text in the field.
- To change the color:
- Click the Override Colors checkbox.
- Click the color that you want to change.
- Click the new color in the color picker box.
- Click
 to save the new color.
 - Optional: Click Yes to enable color gradient.
For more information see Waterfall Chart Settings.
Resolved Issues
- [UA-4024] - In the Custom Builder, when a Function type with the Average condition is applied, the values now display correctly.
- [UA-4346] - When navigating from a report containing formulas, the reports now display correctly.
- [UA-4667] - Reports containing pivot rules now display correctly.
- [UA-5190] - Numeric Custom Fields now display correctly in reports and graphs/charts.
- [UA-5264] - Reports containing single column pivot on measure now display correctly.
- [UA-5433] - Reports containing partitions now display correctly.
- [UA-5545] - All security issues related to Super Admins have been resolved.
- [UA-5661] - Reports containing fixed column sized now display correctly.
- [UA-5667] - Users are now able to remove sorting configurations using the Report settings.
- [UA-5978] - Users are now able to create a Line chart containing a Length Custom Field.
- [UA-6043] - Users are now able to create reports that contain Custom Fields with empty values.
- [UA-6132] - Users are now able to view reports in the Full Screen view.
- [UA-6133] - In Presentation mode, widgets are now correctly ordered.
- [UA-6134] - In Presentation mode, data grids now load correctly.
- [UA-6162] - When users edit a report, the Totalization bar now remains correctly aligned.
- [UA-6179] - Users are now able to successfully overwrite Pie chart label values and send them to drilldown reports.
- [UA-6258] - Users are now able to create reports and graphs/charts containing percentage formulas.
- [UA-6273] - Pivot columns now work correctly in custom fields on reports.
- [UA-6278] - Sunburst charts now display correctly.
- [UA-6349] - The loading bar has been modified to display correctly on all screens.
- [UA-6440] - When users create a report or graph/chart subscription, at least one E-mail Group, User Recipient or Email Recipient must be selected.
- [UA-6448] - Custom field calculations now work correctly.
- [UA-6509] - Users are now able to successfully create a report containing common columns.
- [UA-6510] - Users are now able to successfully create financial/cost reports with percentage fields.
- [UA-6513] - Users can now successfully sort report columns and change the page size.
- [UA-6531] - Users are now able to successfully open and view Excel files exported from UA.
- [UA-6538] - Users are now able to apply custom fields on reports and graph/charts.
- [UA-6541] - Grand Totals now display on reports.
- [UA-6563] - Users are now able to create reports containing filters that begin with zero.
- [UA-6576] - Reports containing custom field calculations now display correctly.
- [UA-6587] - "No data available" correctly displays when reports and graphs/charts have no data.
- [UA-6596] - The Settings modal now displays correctly for reports and graphs/charts.
- [UA-6610] - When drilling down on fields that do not contain data, the data now displays indicating that the field is blank. In previous releases, "No Data Available" displayed.
- [UA-6615] - Attachments now display in subscribed reports and graphs/charts.
- [UA-6617] - Users are now able to change column position in reports.

 To abort the report.
 To send the report offline.
 To continue and view the report.