Project Portfolio Financial Summary Report
The Project Portfolio Financial Summary report displays Financial Indicator values for a custom selection of Projects. Report builders can determine which Financial Indicators will be reported on, as well as the date range and time intervals. This report can be exported as a PDF file, a Microsoft Excel spreadsheet, or a Microsoft Work document.
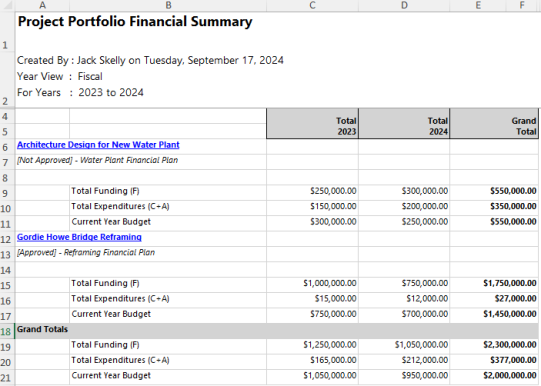
Note: Only the approved Financial Plan will be displayed for each Project included the report. If the Project does not have an approved plan, the most recently edited unapproved plan will be displayed instead.
Tip: For a report that displays Financial Plan data instead of Financial Indicators, see the Project Financial Extract.
Eclipse PPM users can run the Project Portfolio Financial Summary report from the Reports page.
To run the Project Portfolio Financial Summary report:
Before You Start: Projects will only be included in the report if the user running the report has the "Profile Details - View" permission on at least one of the Project's Policies. Additionally, the user will need the "Project Financials - View" permission on at least one of the Project's Policies in order for the Financial Indicator data to actually appear on the report. Consider this before tasking an Eclipse PPM user with running this report.
-
Select the Reports icon
 from the Navigation Menu.
-
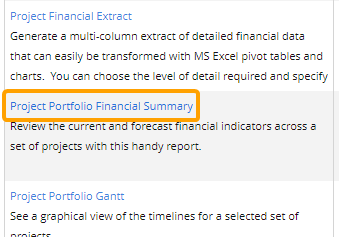
Select Project Portfolio Financial Summary from the list of Eclipse Reports.
-
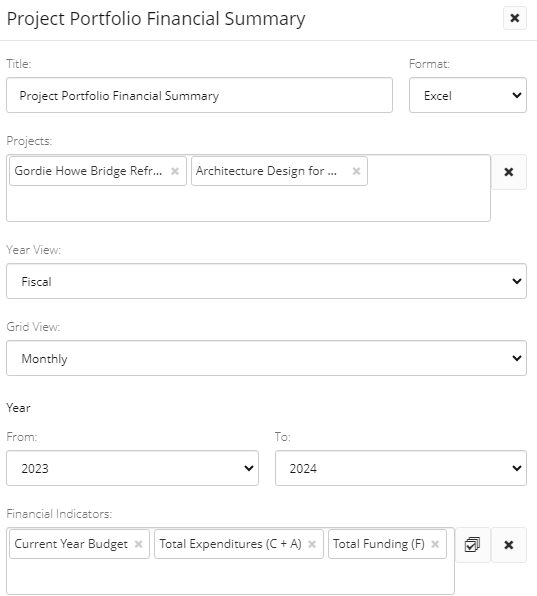
Use the "Project Portfolio Financial Summary" window to customize your Project Portfolio Financial Summary report.
-
Title: Enter a custom name for your Project Portfolio Financial Summary report. This name will be displayed at the top of the report.
-
Format: Determine whether the report will be downloaded as a PDF file, a Microsoft Excel spreadsheet, or a Microsoft Word document.
Note: If PDF is selected, it is usually easier to use the "Two Page View" to read the report.
-
Projects: Select which Projects will be included in the report by typing in the name of a Project or Project filter and selecting it from the drop-down menu. Repeat this until all of your desired Projects and filters have been added.
Note: These are the same Project filters that can be found on the Project Search page. From here, users can create their own custom Project filters that can be used in the report.
Note: A message will appear if the selected filter(s) will result in no Projects being included in the report.
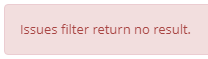
This could be the result of selecting a filter (or multiple) that does not include any Projects. It could also occur if the user running the report does not have permission to view any of them. -
Year View: Determine whether the *******
-
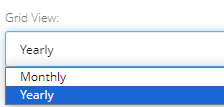
Grid View: Determine whether the report will be formatted with monthly or yearly intervals.
-
Monthly: The report will contain columns for each month, as well as an annual total column for each year and a grand total column on the right-hand side.
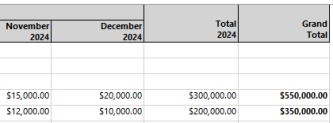
Note: When this is selected, Financial Plans set to yearly time scales will only display values in the annual total columns. Financial Plan time scales can be edited while configuring a Project's Financial Worksheet settings.
-
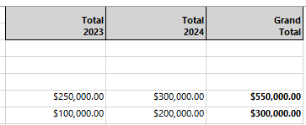
Yearly: The report will contain annual total columns, as well as a grand total column on the right-hand side.
-
-
Year: Use the "From" and "To" drop-down menu to determine a date range. The report will only display columns within this range.
-
Financial Indicators: Determine which Financial Indicators will be included for each Project in the report. Selecting the box will open up a drop-down menu allowing the user to scroll to any of the indicators. Alternatively, begin typing the name of a Financial Indicator into the box and select it from the menu of suggestions that appears.
Note: Select the Select all button
 to automatically select every Financial Indicator or select the Clear button
  to clear the box of all Financial Indicators.
-
-
Select the Run button.
After selecting Run, the report will automatically download onto your device in your selected format.