Project Portfolio Gantt Report
The Project Portfolio Gantt report provides a graphical view of Project Schedules, Milestones, and overall progress for a custom selection of Projects.
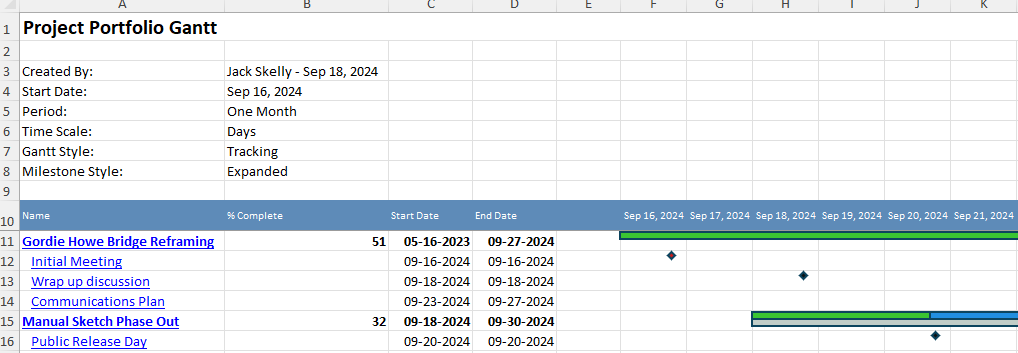
The top-left hand corner of the report (directly under the title) displays some metadata about the report, such as the user who ran it, the date it was run, and the type of data it captures.
Note: The procedure below provides explanations of what this data means ("Gantt Style", "Milestone Style", etc.).
The left-hand side of the table includes columns that display information about each Project included in the report
This page covers the following topics:
Progress Bar
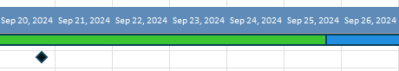
Directly to the right of the Project information columns is the Gantt chart. It displays the current progress for each listed Project.

The bar on top
Example: In the image above, we can see that half of the progress bar is green. This is because the Project is 50% complete.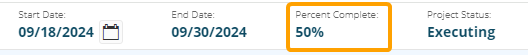
Note: The progress will not be adjusted for the start and end dates of the report itself. If the green portion of the bar does not seem to reflect the Project's current percent complete, it is probably because the entire Project duration is not displayed in the Gantt chart.
Baseline Bar
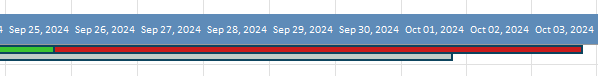
Directly under the progress bar is a gray bar that represents the Project's current Baseline.
Note: Baselines will only be included if the "Gantt Style" is set to "Tracking" while configuring the report's "Options". If not, the Baseline bar will not appear and the progress bar will not turn red if it surpasses the current Baseline.
If the Project is either on track to meet the Baseline or ahead of the Baseline, the non-green portion of the progress bar will be blue
Note: Baselines will only be included if the "Gantt Style" is set to "Tracking" while configuring the report's "Options". If not, the Baseline bar will not appear and the progress bar will not turn red if it surpasses the current Baseline.
Milestones
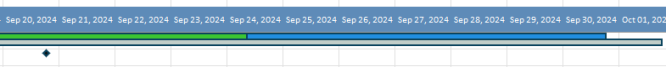
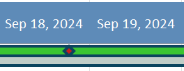
Users can choose to include Milestones in the Gantt chart. Each Milestone will be displayed as a diamond.
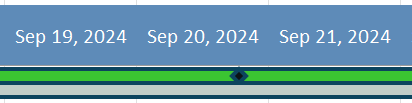
This diamond represents a Milestone with an end date of September 20th.
If the Milestone's end date has passed and it has not been completed, the diamond will turn red.

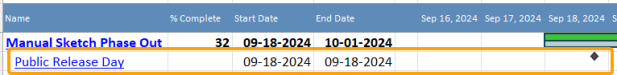
If the user chooses a "Milestone Style" of "Embedded" while configuring the report's "Options", the Milestone diamonds will appear directly within the progress bar (like above). On the other hand, selecting a "Milestone Style" of "Expanded" will create additional spreadsheet rows for each Milestone.

Note: Only the "Start Date", "End Date", and "Days" columns will expose data for Milestone rows.
Running the Project Portfolio Gantt Report
Eclipse PPM users can run the Project Portfolio Gantt report from the Reports page.
To run the Project Portfolio Gantt Report:
Before You Start: Projects will only be included in the report if the user running the report has the "Profile Details - View" permission on at least one of the Project's Policies. Additionally, the user will need the "Project Schedule - View" permission on at least one of the Project's Policies in order for the Project data to actually appear on the report. Consider this before tasking an Eclipse PPM user with running this report.
-
Select the Reports icon
 from the Navigation Menu.
-
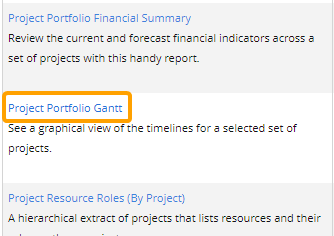
Select Project Portfolio Gantt from the list of Eclipse Reports.
-
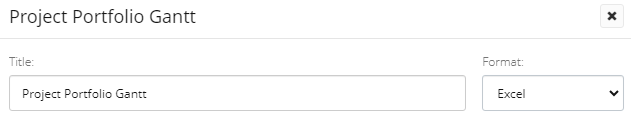
Edit the basic report details at the top of the "Project Portfolio Gantt" window.
-
Title: Enter a custom name for your Project Portfolio Gantt report. This name will be displayed at the top of the report.
-
Format: Ignore this field for this report; the only available export option is a Microsoft Excel file.
-
-
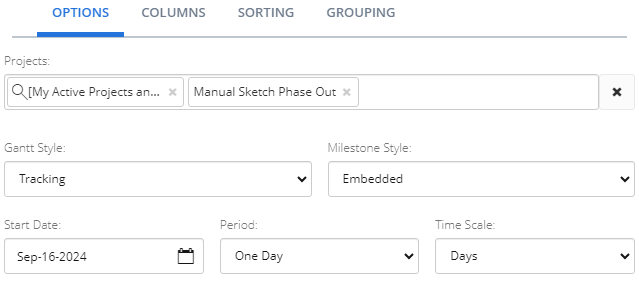
Edit the "Options" for your report.
 Click here for information on "Options"
-
Projects: Select which Projects will be included in the report by typing in the name of a Project or Project filter and selecting it from the drop-down menu. Repeat this until all of your desired Projects and filters have been added.
Note: These are the same Project filters that can be found on the Project Search page. From here, users can create their own custom Project filters that can be used in the report.
Note: A message will appear if the selected filter(s) will result in no Projects being included in the report.
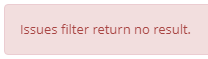
This could be the result of selecting a filter (or multiple) that does not include any Projects. It could also occur if the user running the report does not have permission to view any of them. -
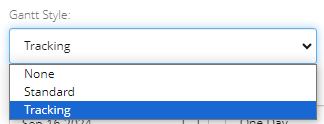
Gantt Style: Determine how the Gantt chart will appear on the report.
-
None: The report will not feature a Gantt chart.
-
Standard: The report will feature a Gantt chart with a progress bar and Milestones. A Baseline bar will not be included.
Note: If this is selected, the non-green portion of the progress bar will not turn red if the Project end date extends past the current Baseline.
-
Tracking: The report will feature a Gantt chart with a progress bar, Milestones, and a Baseline bar that displays the current Baseline.
Note: If this is selected, the non-green portion of the progress bar will turn red if the Project end date extends past the current Baseline.
-
-
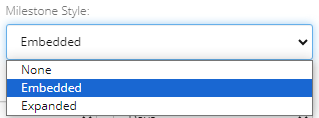
Milestone Style: Determine how Milestones will appear on the report.
-
None: The report will not feature Milestones.
-
Embedded: The report will display Milestones within the progress bar.
-
Expanded: The report will display Milestones in their own separate spreadsheet rows.
Note: Only the "Start Date", "End Date", and "Days" columns will expose data for Milestone rows.
-
-
Start Date: Select the Calendar icon
 to determine when the report will begin collecting data. Schedule data from before this date will not be included in the Gantt chart.
Note: The Start Date will automatically adjust to the first day of the selected date's week.
-
Period: Determine the length of time covered by the Gantt chart.
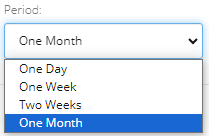
Note: The available options will differ based on the "Time Scale" selection (below).
-
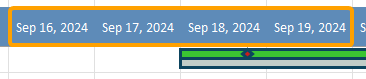
Time Scale: Determine the time period covered by each column on the Gantt chart.
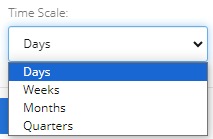
Example: If "Days" is selected, each column will represent a day.
-
-
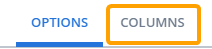
Select the Columns tab.
-
Edit the "Columns" settings for your report.
Click here for information on "Columns" settings
-
Available Columns: Use the drop-down menu to select a category of columns that will expose Project data in the report.
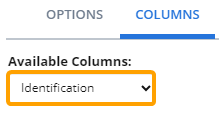
Select the checkboxes of the columns you would like to include in the report.
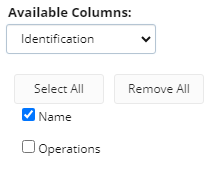
Tip: Press the Select All button to automatically select every column in the category or press the Remove All button to automatically deselect them.
Each selected column will appear to the left of the Gantt column in the report.
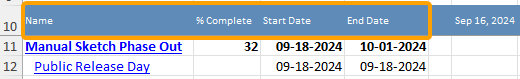
Note: Only the "Start Date", "End Date", and "Days" columns will expose data for Milestone rows.
-
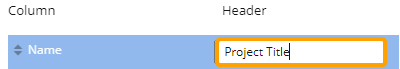
Selected Columns: Drag and drop the selected columns into the order they should appear on the report. The top-to-bottom order of the selected columns will be reflected from left-to-right in the report.
Use the "Header" textboxes to give custom names to any columns headers on the report.
-
-
Select the Sorting tab.
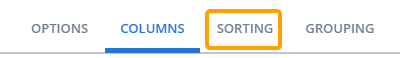
-
Edit the "Sorting" settings for your report.
Note: Sorting refers to arranging Projects in a specific sequence based an attribute. It organizes the list of Projects in a linear order, either ascending or descending. Grouping, on the other hand, refers to clustering Projects in the report by shared characteristics. See Step 10 for information on the report's "Grouping" settings.
Click here for information on "Sorting" settings
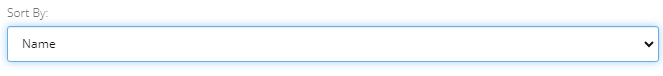
Use the "Sort By" drop-down menu to determine how Projects in the report will be sorted in the report.
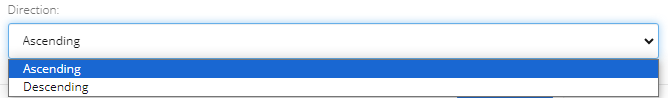
Use the "Direction" drop-down menu to determine the sorting order of the Projects.
-
Ascending: The Projects will be ordered from top-to-bottom in alphabetical / numerical / chronological (for dates) order.
-
Descending: The Projects will be ordered from top-to-bottom in reverse alphabetical / numerical / chronological (for dates) order.
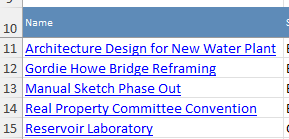
Example: In the images above, Projects will be sorted in ascending order (alphabetically) by their names.
-
-
Select the Grouping tab.
Note: Grouping refers to clustering Projects in the report by shared characteristics. Sorting, on the other hand, refers to arranging Projects in a specific sequence based an attribute. It organizes the list of Projects in a linear order, either ascending or descending. See Step 8 for information on the report's "Sorting" settings.
Click here for information on "Grouping" settings
Use the "Column" drop-down menu to determine which characteristic the Projects will be grouped by.
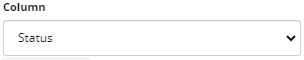
In this example, each Project will be grouped by its "Status" value. Projects with appear together if they share the same Status.Use the "Direction" drop-down menu to determine the sorting order of the groups on the report.
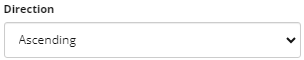
In this example, each "Status" group will be sorted alphabetically by Status name.Select the Add Group button to add a secondary group to the report.
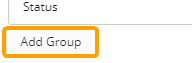
Selecting the button again will create a third group, and so on.
Example: Take a look at these "Grouping" settings with a primary group and a secondary group.
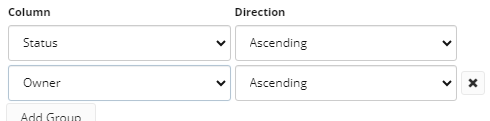
Additionally, the report's "Sorting" settings are set to sort Projects ascendingly by their names.
The Projects will appear like this on the report: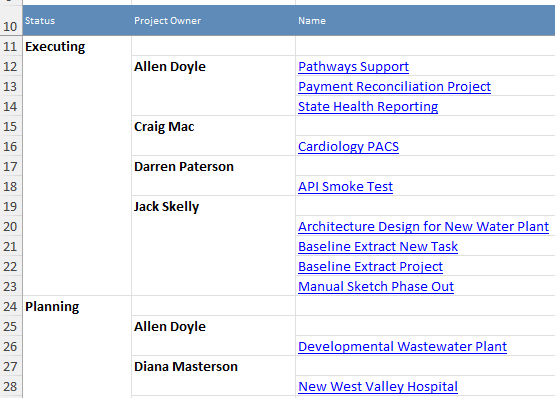
The selected groups, "Status" and "Owner", have both been added as columns to the left of the Project information. The Projects are primarily organized by the first group, which is "Status". In the report above, all of the Projects with an "Executing" Status and an "Planning" Status have been grouped together. Notice that the Statuses are listed in ascending alphabetical order because the "Direction" for this group has been set to "Ascending".
The next group is "Owner", so each Project will be grouped secondarily by their Project Owners. In the image above, for example, notice that all of the Projects with an "Executing" Status are grouped by their Owners.
Finally, notice that the Projects in each group are listed in alphabetical order by their names. This is because of the report's "Sorting" settings (for more information on "Sorting" settings, see Step 8). -
Select the Run button.
After selecting Run, the report will automatically download onto your device in a Microsoft Excel spreadsheet.