Change the Resource Review Display
The Resource Review page provides a centralized view of Resource allocation (effort) and availability across work items, as well as any unstaffed demand that currently exists.
Users can determine how the Resource Review data is organized and arranged by configuring the display options.
Tip: If you would like to save your Resource Review display settings, you can save them as a Resource Review Layout.
Note: For information on filtering out certain data from the Resource Review page, see Filtering the Allocation Section and Filtering the Demand Section. For information on determining how availability values are calculated in both sections, see Filter Resource Review Availability.
This page explains how to configure the Resource Review display options using both Resource Review interfaces:
Change the Resource Review display using the new interface
The 2025R1.0 version of PowerSteering introduced the first phase of a new Resource Review user interface. This new page features a cleaner and more refined design that is much easier to use. PowerSteering users are encouraged to familiarize themselves with the new interface as much as possible because the legacy page will eventually be deprecated in a future release.
The following display settings are exclusive to the new Resource Review interface:
-
Include or exclude the Allocation or Demand sections
-
Display work item Sequence Numbers
-
Sort Resources by last name instead of first name
The following display settings are currently exclusive to the legacy interface:
-
Priority
-
Yellow and Red Thresholds
-
Apply "Precision" to all layouts
-
Display Canceled projects
-
Additional column options
To change the Resource Review display using the new interface:
Before You Start: All PowerSteering users can access the Resource Review page and change the display settings of Resource Review Layouts that they can access. However, users can only view the data through Resource Review Layouts they have saved themselves or that have been shared with all users. Additionally, users can only view work items and users that they have permission to view. For instance, users without the "View" Project Task permission on a work item will not be able to view the work item on the Resource Review page: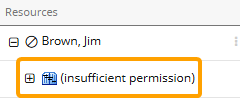
-
Select Review
 → Resource Review (New) from the Navigation Menu.
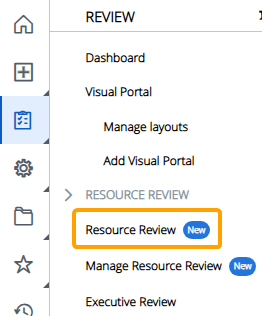
-
Select a Resource Review Layout using the "Layout" drop-down menu.
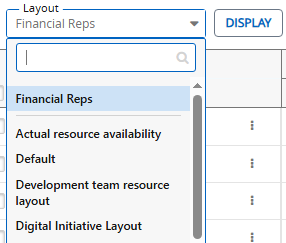
Note: The layouts above the gray line are layouts that have been shared with you. The layouts below the line are your own private layouts.
Note: Speak to a PowerSteering administrator if you are unsure about which layout to use.
-
Select the Display
 icon.
icon.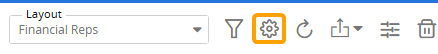
-
Configure the Resource Review Layout's display settings.
Select any of the settings below to learn more about their options:
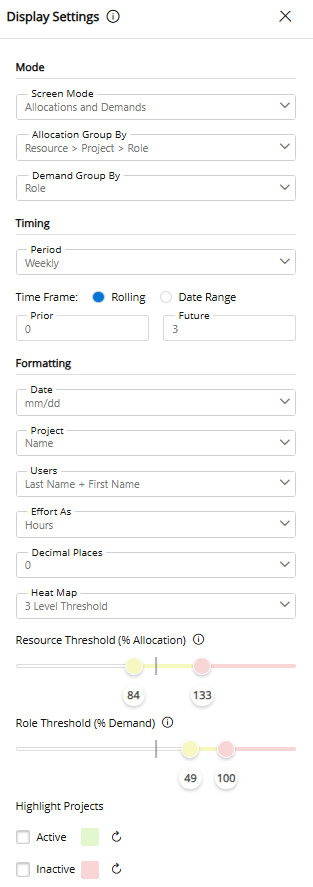
 Mode
Mode
-
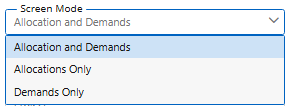
Screen Mode: Determine which components of the Resource Review page will be displayed.
-
Allocations and Demands: Both the Allocation (top) and Demand (bottom) sections will be displayed.
-
Allocations Only: Only the Allocation (top) section will be displayed.
-
Demands Only: Only the Demand (bottom) section will be displayed.
-
-
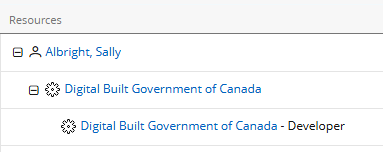
Allocation Group By: Determine how the data in the Allocation (top) section will be grouped.
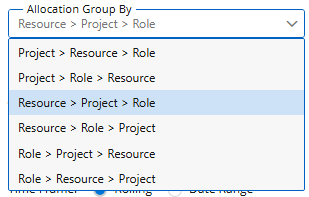
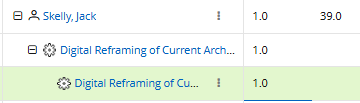
Example: Selecting Resource > Project > Role will list the assignment data primarily by Resources. Expanding a Resource line item will reveal the Project line item(s). Finally, expanding a Project line item will reveal the Role line item(s).
Note: The "Project" line item will always be the closest parent of the work item the Resource is assigned to with an "Is project" Object Type. If the work item has an "Is project" Object Type itself, it will be displayed in both the "Project" and "Role" line items.
Note: Resource Review Bulk Actions can only be applied to the Allocation (top) section when either Project > Resource > Role or Resource > Project > Role has been selected.
-
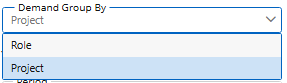
Demand Group By: Determine how the data in the Demand (bottom) section will be grouped.
-
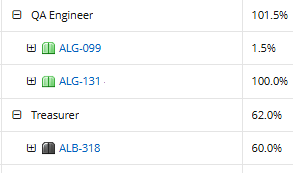
Role: The data will be primarily grouped by Resource Role.
-
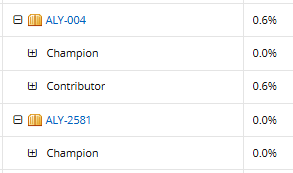
Project: The data will be primarily grouped by work item.
-
Timing
- Period: Determine whether the time periods on the Resource Review page will be daily, weekly, or monthly.
-
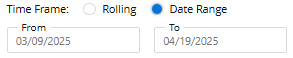
Time Frame: Choose a method for determining a range of displayed time periods.
-
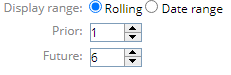
Rolling: The date range will be a rolling period that stays up to date as time goes on. It will always display a set number of time periods before and after the current period. When this option is selected, the user will have to determine how many periods will be displayed before and after the current period:
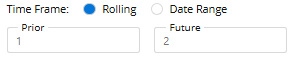
Example: Imagine it is April and the Resource Review page uses "Monthly" periods. If the settings pictured above are applied, the months from March (1 month prior) to June (2 months in the future) will be displayed.
-
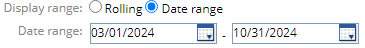
Date range: The date range will be a static set of time periods that will not change over time. When this option is selected, the user will have to determine the start and end dates.
-
Formatting
- Date: Determine how dates will be formatted on the Resource Review page.
-
Project: Determine how work item names will be formatted on the Resource Review page. Users can decide to display work item names, sequence numbers, or both.
-
Users: Determine how Resource names will be formatted on the Resource Review page. Resource names can be formatted with the first name before the last name or vice versa.
-
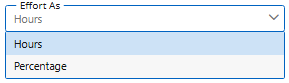
Effort As: Determine how effort will be displayed on the Resource Review page (both the "Allocations" and "Demand" sections):
-
Hours: The effort and demand data will be displayed as hours.
-
Percentage: The effort and demand will be displayed as percentages of the Resource's total availability.
-
-
Decimal Places: Determine whether whole numbers, numbers with one decimal place, or numbers with two decimal places will be displayed.
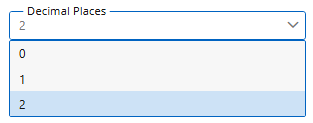
Note: The selected decimal places will be applied to values even if they do not require them. For instance, a whole number will still display two zeroes after the decimal point if "2" is selected from the drop-down menu.
-
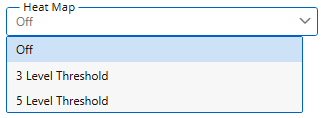
Heat Map: Apply an availability Heat Map to the Resource Review page. The colors are used to indicate the amount of remaining availability for Resources in the Allocation (top) section and Roles in the Demand (bottom) section.
-
Off: An availability Heat Map will not be applied to the Resource Review page.
-
3 Level Threshold: Only three colors will be used to indicate availability. A simple "High / Medium / Low" availability scale will be displayed for each section.
-
5 Level Threshold: Five colors will be used to indicate availability.
Tip: This option should be used if your Demand (bottom) section commonly displays any negative minimum availabilities. Select Demand below for more information.
Availability Heat Maps will affect both sections of the Resource Review page:
Allocation
If a Heat Map is applied, the "Resource Threshold (% Allocation)" scale will affect the Allocation (top) section.
Resource Threshold colors indicate how much of a Resource's available working time is already booked for the time period. It uses a value called "% Allocation", which represents the percentage of the Resource's total effort that is currently allocated.
The following equation is used to calculate a Resource's "% Allocation":
(Total effort assigned ÷ Total Resource capacity) x 100 = % Allocation
Note: This equation applies whether effort is displayed in hours or as a percentage.
Note: Remember that Resources may have different total capacities based on the "Project availability" settings from their profiles. For example, a specific Resource might work 30 hours a week while every other Resource works 40 hours. In this case, this specific Resource would have a "Total Resource capacity" of 30 for the week instead of 40 if hours are used to display effort. If percentages are used to display effort, however, the Resource's "Total Resource capacity" will still be 100%.
The color of a Resource's "Effort / Allocation" and "Availability" cells for a specific time period will correspond with the Resource Threshold color spectrum.
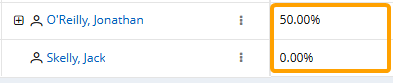
Example: Jonathan works a total of 40 hours each week. This week, he is currently assigned to one Project with an allocation of 20 hours.
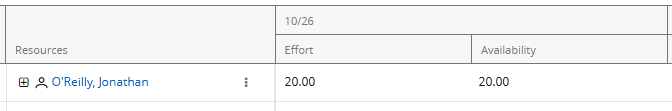
This means the "% Allocation" equation will be as follows:
20 (total effort assigned) ÷ 40 (total Resource capacity) x 100 = 50
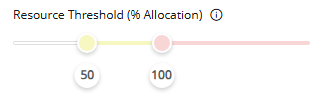
Once a Heat Map is added, 50 lands in the yellow range: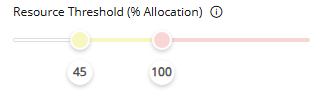
This causes Jonathan's cells to turn yellow for the week.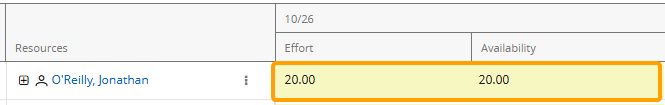
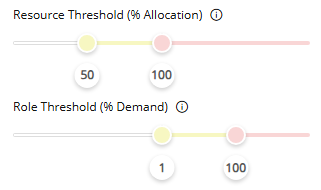
Tip: Users can configure the "Resource Threshold (% Allocation)" scale however they like, but it should reflect how close a Resource is to full allocation for the time period. For example, take a look at the following scale:
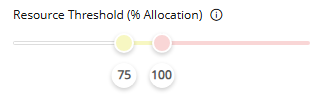
In this example, a Resource's cells will turn yellow when their available time is almost fully allocated for the week (75% allocated). This warns the Resource Manager that the Resource is nearing full allocation for the week. Once the Resource is fully booked with no more available time left (100% allocated), their cells will turn red. This indicates that the Resource cannot take on any more assignments during the time period.Demand
If a Heat Map is applied, the "Role Threshold (% Demand)" scale will affect the Demand (bottom) section.
Role Threshold colors indicate how much effort is available for a Role compared to its current unstaffed demand. It uses a value called "% Demand", which represents the percentage of a Role's minimum availability that the unstaffed demand requires.
The following equation is used to calculate a Role's "% Demand":
(Total demand x 100) ÷ Minimum availability = % Demand
Note: This equation applies whether effort is displayed in hours or as a percentage.
Note: If there is only one value displayed in a Role's "Availability" cell, the minimum and maximum availability for the Role are the same. If the minimum and maximum availability values are different, the minimum availability is the first value displayed.
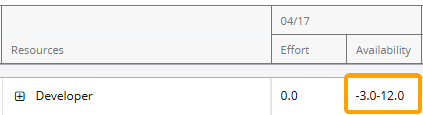
See Demand Section for more information on minimum availability.The color of a Role's "Effort / Allocation" and "Availability" cells for a specific time period will correspond with the Role Threshold color spectrum.
Example: There are currently 40 hours of unstaffed demand for a "Receptionist" for the week of October 26th. The minimum availability for the Role is 80 hours.
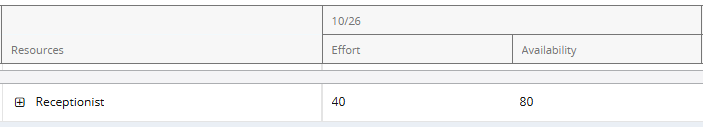
This means the "% Demand" equation will be as follows:
(40 (total demand) x 100) ÷ 80 (minimum availability) = 50
Once a Heat Map is added, 50 lands in the yellow range: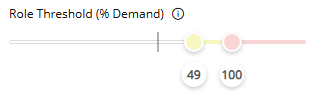
This causes the "Receptionist" cells to turn yellow for the week.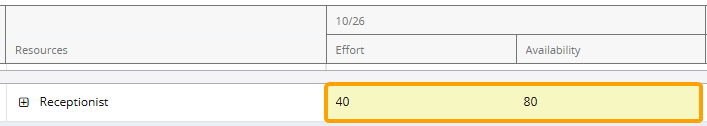
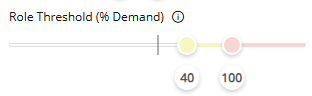
Tip: If a "3 Level Threshold" Heat Map is applied, it should reflect how close the Role is to running out of availability for the time period. For example, take a look at the following scale:
In this example, a Role's cells will turn yellow when it requires 50% or more of the current minimum availability. This warns the Resource Manager that the Role is running out of availability for the time period. Once the Role requires the total amount of minimum availability (100%) or more, the cells will turn red. This indicates that either more availability or less demand is required.Tip: It is important to keep in mind that minimum availability values can also be negative. When this occurs, the "% Demand" value will be a negative integer. For example, imagine the "Receptionist" Role has a minimum availability of -60 hours for the week.
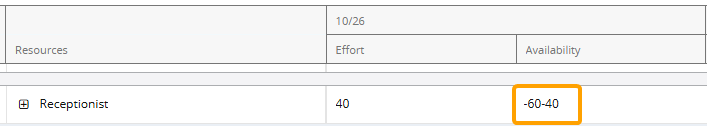
The "% Demand" will be as follows:
(40 (total demand) x 100) ÷ -60 (minimum availability) = -66.7
The following "3 Level Threshold" Heat Map will only turn cells yellow when the "% Demand" value reaches -25, so the cells will not receive a color.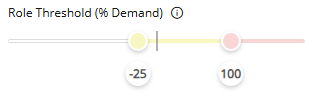
This is a problem because a "% Demand" value of -66.7 is much more worthy of a warning than a value of -25 or higher.
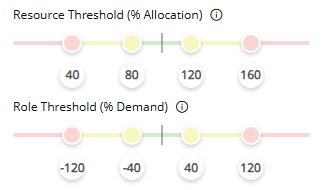
This is why the "5 Level Threshold" Heat Map should be applied when negative minimum availabilities are common. Similar to "% Demand" values over 100, negative "% Demand" values indicate that there is no more availability to cover the Role's current unstaffed demand. Take a look at the following scale: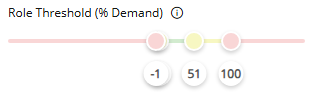
It has been configured in a way that turns a Role's cells red if they display a negative minimum availability OR if it requires more than the current minimum availability to cover its unstaffed demand. -
-
Highlight Projects: Apply a highlight to active and/or inactive work items on the page.
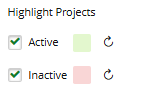
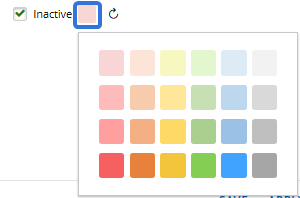
Selecting the "Active" or "Inactive" checkboxes will highlight active and/or inactive work items with the color.
Select the colors themselves to determine the highlight color for the status type.
Tip: View the Work Status Names page to see which Statuses are considered "Active" and "Inactive".
-
-
Use the options at the bottom of the "Display" window to determine how you would like to apply your changes to the current Resource Review Layout.
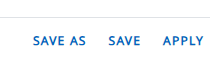 Save As
A new Resource Review Layout will be created for the current configuration of filters and display settings. This will open up the "Save Layout" window, which allows the user to create a name for the layout and determine whether other users can view it.
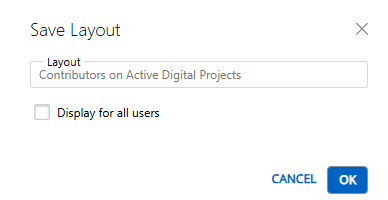
Note: Layouts that are displayed for all users can be deleted by any users that can view them.
Save
The filter and display changes will be saved to the current Resource Review Layout.
Apply
The filter and display changes will be applied to the data, but they will not be saved to any layout. Leaving or refreshing the page will result in the changes being lost.
After selecting one of the options at the bottom of the "Display" window, your display configurations will be reflected on the Resource Review page.
Change the Resource Review display using the legacy interface
The legacy Resource Review page is still available to PowerSteering users. It can be accessed the exact same way it could prior to the 2025R1.0 release. Although users are encouraged to familiarize themselves with the new Resource Review interface, the legacy interface still offers functionality that has not yet been added to the new page.
The following display settings are currently exclusive to the legacy interface:
-
Priority
-
Yellow and Red Thresholds
-
Apply "Precision" to all layouts
-
Display Canceled projects
-
Additional column options
To change the Resource Review display using the legacy interface:
Before You Start: All PowerSteering users can access the Resource Review page and change the display settings of Resource Review Layouts that they can access. However, users can only view the data through Resource Review Layouts they have saved themselves or that have been shared with all users. Additionally, users can only view work items and users that they have permission to view. For instance, users without the "View" Project Task permission on a work item will not be able to view the work item on the Resource Review page:
-
Select Review
→ Resource Review → your preferred Resource Review Layout from the Navigation Menu.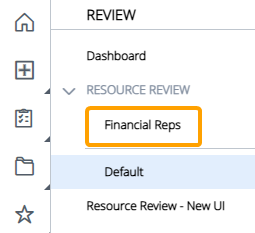
Note: The layouts above the gray line are layouts that have been shared with you. The layouts below the line are your own private layouts.
-
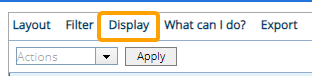
Select the "Display" tab in the top left-hand corner of the table:
-
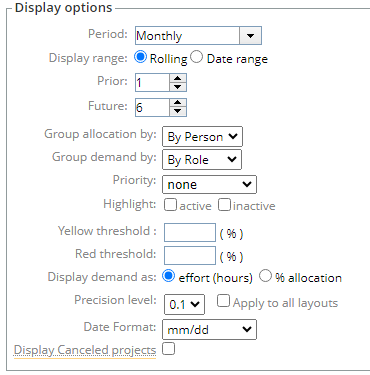
Configure the display options:
-
Period: Determine whether the time periods on the Resource Review page will be daily, weekly, or monthly.
-
Display range: Specify how the time periods will be displayed on the Resource Review page:
-
Rolling: The date range will be a rolling period that stays up to date as time goes on. It will always display a set number of time periods before and after the current period. When this option is selected, the user will have to determine how many periods will be displayed before and after the current period:
Example: Imagine it is April and the Resource Review page uses "Monthly" periods. If the settings pictured above are applied, the months from March (1 month prior) to October (6 months in the future) will be displayed.
-
Date range: The date range will be a static set of time periods that will not change over time. When this option is selected, the user will have to determine the before and after dates of the date range.
-
-
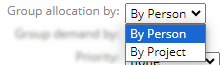
Group allocation by: Determine how data in the allocation section will be grouped.
-
By Person: The data will be grouped by Resource.
-
By Project: The data will be grouped by work item.
-
-
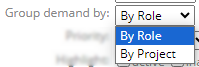
Group demand by: Determine how data will in the unstaffed demand section will be grouped.
-
By Role: The data will be grouped by Resource Role.
-
By Project: The data will be grouped by work item.
-
-
Priority: Use the drop-down menu to filter the work items in the Demand section by their Priority. Only work items of the selected Priority will be displayed. If none is selected, no filter based on Priority will be applied.
-
Highlight: Apply a highlight to inactive and/or active work items on the page. Selecting "active" will highlight the work items with "Active" Statuses in blue. Selecting "inactive" will apply a yellow highlight to work items with an "Inactive" Status.
Tip: View the Work Status Names page to see which Statuses are considered "Active" and "Inactive".
-
Yellow threshold (%): For allocation summary rows, set a percent value to define the lower limit of the yellow threshold. If the percentage of capacity is between this value and the "Red Threshold (%)" (below), the data will be highlighted yellow. If the percentage capacity is below this value, the data will not be highlighted at all.
-
Red threshold (%): For allocation summary rows, set a percent value to define the lower limit of the red threshold. If the percentage of allocated capacity is above this value, the data will be highlighted red.
Select the tabs below for more information on yellow and red thresholds for each section:
Allocation
Users can add percentage values into the "Yellow threshold" and "Red threshold" fields to determine the percentage of availability that will cause a Resource's "Effort" and "Availability" cells to change color for a specific time period.
In the Allocation (top) section, these thresholds check how much of a Resource's available working time is already allocated. The color of a Resource's "Effort" and "Availability" cells will change based on the percentage of the Resource's capacity that is allocated. If it is more than or equal to the "Red threshold" limit, the Resource is flagged as overloaded (red) for the time period. If it's below the "Red threshold" limit but higher than the "Yellow threshold" limit, the Resource will be flagged as close to overloaded (yellow). If it's below the "Yellow threshold" limit, it is within a safe workload and will not contain a special color. This helps Project Managers quickly identify who is overbooked and who still has room to take on more work.
The thresholds should be set up in a way that articulates the following:
 Red cell: The Resource is overloaded or at capacity. No more work should be assigned.
 Yellow cell: The Resource is close to being overloaded.
 Blue cell: The Resource has a manageable workload.
Percentages of the Resource's total capacity are calculated using the following equation:
Percentage of capacity = (Total effort assigned ÷ Total available time) x 100
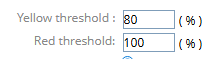
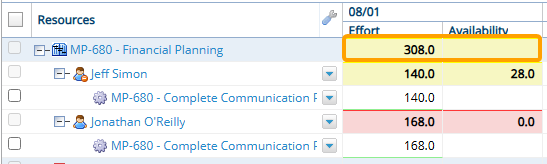
Example: The Resource Review page is set to display monthly periods. In the month of August, each Resource has a maximum of 168 working hours. The "Yellow threshold" is set to 80% and the "Red threshold" is set to 100%.
This means that "Effort" and "Availability" cells will be red when the Resource meets their full allocation for the month (168 hours or more).
In this example, Jeff has reached 168 hours (100% allocation), so his cells are red for the month of August.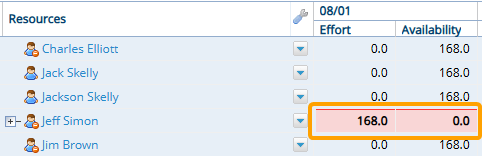
This is because (168 ÷ 168) x 100 = 100, which meets the "Red threshold" value.
One hour is taken away from Jeff's effort in August, which gives him a total of 167 hours for the month. Now, the equation is (167 ÷ 168) x 100 = 99.4 .
Because 99.4% is between the "Yellow threshold" and "Red threshold" values, the cells will change to yellow for August.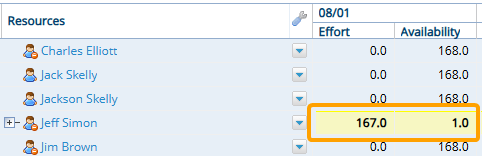
Finally, Jeff's total allocated effort has been reduced to only 84 hours in August. Now, the equation is (84 ÷ 168) x 100 = 50. Because 50% is lower than the "Yellow threshold" value, the cells will remain blue for August.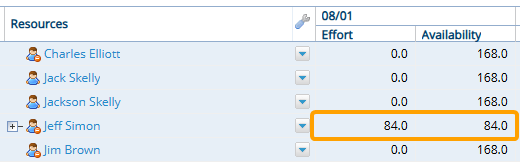
Note: The "Total effort assigned" and "Total available time" values are calculated using the work items on the Resource Review page. If the "Include projects from outside the portfolio" filter option is not selected, these values will only take work items from the selected Portfolio into account. This means that you may not be viewing a Resource's full effort and availability.
Note: If the "Group allocation by" display option is set to "By Project", the threshold colors will be applied to the work item row as well.
Work item cells will take the lower color displayed by a Resource directly under them. In the example above, one of the Resources listed under the "Financial Planning" project has yellow cells and the other Resource has red cells. This causes the "Financial Planning" project to display yellow cells.Demand
Users can add percentage values into the "Yellow threshold" and "Red threshold" fields to indicate how difficult it might be to fill unstaffed demand based on the minimum availability.
Note: Minimum availability represents the total availability toward a Role if every Resource with the Role on their profile was fully allocated toward every other Role on their profile. It is represented by the first value in the "Availability" column if there is a range.
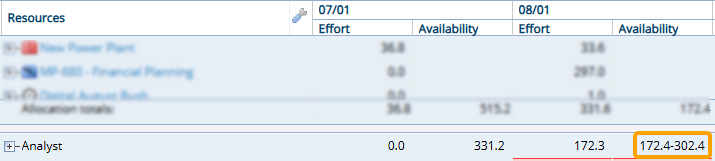
In this example, the minimum availability is 172.4 hours.
For more information and examples, see Demand Section.These thresholds compare a Role's unstaffed demand to its current minimum availability. The colors highlight where staffing shortages are likely; if the required demand for a Role is high compared to its availability, a staffing bottleneck could occur. Setting these thresholds will ensure that Resource Managers are not blindsided by availability gaps that could delay work.
The thresholds should be set up in a way that articulates the following:
Red cell: There is not enough (or a dangerously low amount of) availability to cover the demand.Note: If minimum availability is less than the demand, the cells will be colored red even if the "Red threshold" has not been set.
Yellow cell: There is enough availability to cover the demand, but the coverage is tight. Blue cell: There is ample availability to cover the demand.The thresholds use the following equation to calculate the percentage of availability:
Percentage of availability = (Total demand x 100) ÷ Minimum availability
Example: The Resource Review page is set to display monthly periods. The "Yellow threshold" is set to 80% and the "Red threshold" is set to 100%.
This means that "Effort" and "Availability" cells will be red when a Role has no availability left according to its minimum availability.
In this example, the "Analyst" Role currently has a total of 134.4 hours of demand. The minimum availability for the Role is also exactly 134.4 hours, so the cells are red for the month of August.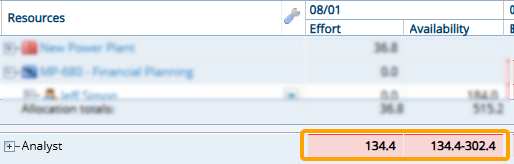
This is because (134.4 x 100) ÷ 134.4 = 100, which meets the "Red threshold" value.
One hour is taken away from the demand for an Analyst, which means there are now 133.4 hours of demand for the month. Now, the equation is (133.4 x 100) ÷ 134.4 = 99.3.
Because 99.3% is between the "Yellow threshold" and "Red threshold" values, the cells will change to yellow for August.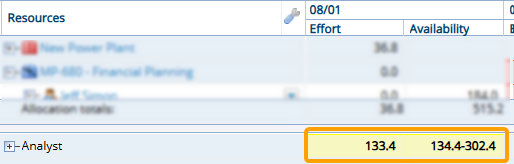
Finally, a project has been canceled and the "Analyst" demand effort has been reduced dramatically to only 70 hours for the month of August. Now, the equation is (70 x 100) ÷ 134.4 = 52.1. Because 52.1% is lower than the "Yellow threshold" value, the cells will remain blue for August.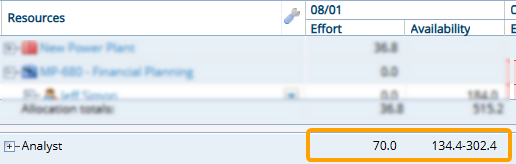
Note: If the "Group demand by" display option is set to "By Project", the threshold colors will be applied to the work item row as well.
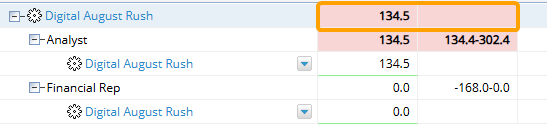
Work item cells will take the lower color displayed by a Role directly under them. In the example above, one of the Roles listed under the "Digital August Rush" project has red cells. None of the listed Roles have yellow cells, so the "Digital August Rush" project displays red cells. -
Display demand as: Determine how the demand data will be displayed:
-
Effort (hours): The demand data will be displayed as hours.
-
% allocation: The demand will be displayed as percentages of the Resource's total availability.
-
-
Precision level: Determine how precise the figures will be:
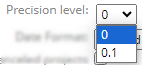
-
0: Each value will be rounded to whole numbers; they will not contain any decimal numbers.
-
0.1: Each value will be rounded to the nearest tenth; they will all contain one decimal number.
-
-
Apply to All Layouts: Select this checkbox to apply the "Precision" setting (above) to all saved Resource Review Layouts.
-
Date Format: Determine how the dates in the column headers will be formatted.
-
Display Canceled Projects: Select this checkbox to include data from work items with a "Canceled" status.
Note: Work status names can be changed in PowerSteering; the "Canceled" status might be called something different in your PowerSteering environment. Speak to an administrator if you are unsure.
-
-
Select an additional column to add to the Resource Review Layout:
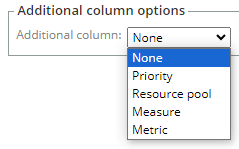
Note: This additional column will appear directly to the right of the "Resources" column.
-
None: No additional column will be added.
-
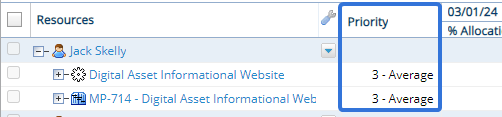
Priority: A column that displays the Priority of each work item will be added:
-
Resource pool: A column that displays the Resource Pools that each Resource belongs to will be added:
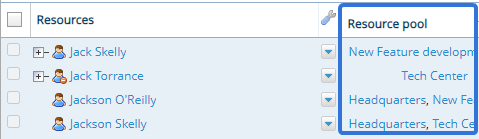
Note: You will probably need to widen the column to see all Resource Pools for certain Resources.
-
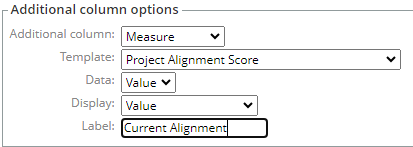
Measure: A column with a specific Measure value will be added. Use the fields that appear to determine which Measure value will be displayed for each work item:
-
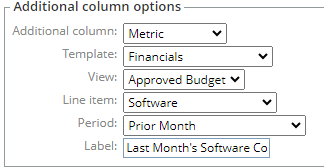
Metric: A column with a specific Metric value will be added. Use the fields that appear to determine which Metric value will be displayed for each work item:
-
-
Select the Apply options button:
After selecting Apply options, your display options will be saved to the Resource Review page. If you would like to revisit the Resource Review page with these same settings again, you should save the Resource Review Layout.