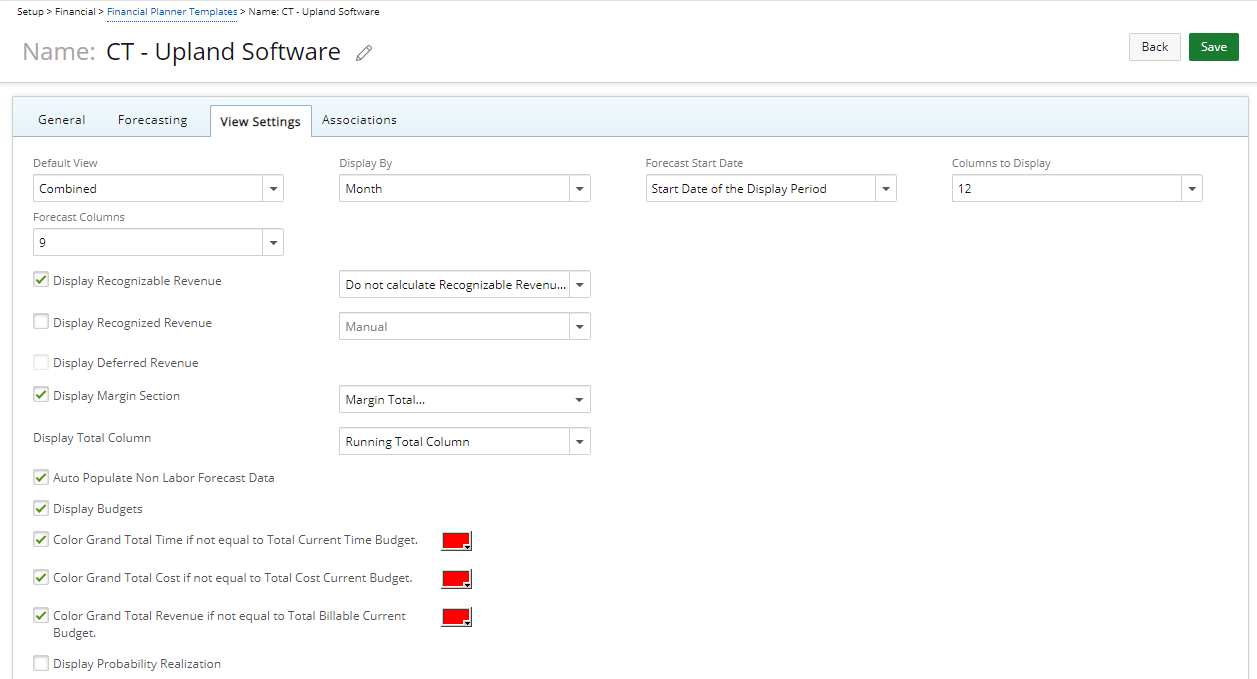
From the View Settings tab of the Financial Planner Template page you can configure how your Financial Planer will be displayed. The Display settings such as the Forecast Start Date and Columns to Display are configured through the View Settings tab.
This article covers how to configure the View Settings tab in a Financial Planner Template, allowing you to customize row visibility and layout preferences.

For each option choose the appropriate setting:
- Default View: for the Default View choose one of the following options:
- Combined: If Combined is selected, the columns displayed in the Project Forecast Grid will be both Actual and Forecast data.
Note: By default Combined is selected.
- Actuals: If Actuals is selected, all the columns displayed in the Project Forecast Grid will be Actual Data. All columns will be read only for Actual Data.
- Forecast: If Forecast is selected, all the columns displayed in the Project Forecast Grid will be forecast data. If there is Forecast Data in the past it’ll be read only.
- Combined: If Combined is selected, the columns displayed in the Project Forecast Grid will be both Actual and Forecast data.
- Display By: This option defines the period for the view on the Project. The available options are: Month, Week, Quarter and Year. By default Month is selected.
- Forecast Start Date: Choose from one of these options: Start Date of the Current Week, End Date of the Current Week or Start Date of the Display Period.
- Columns to Display: Choose between 1 to 36 columns to be displayed on the Financial Planner. By default 12 is selected.
- Forecast Columns: Choose between 1 to 36 columns to be displayed for Forecast Columns. By default 9 is selected.
- Display Recognizable Revenue: When selected the Recognizable Revenue will be displayed. Choose if the Recognizable Revenue should be calculated for the Actual Period or not. The available options to choose from are: Do not calculate Recognizable Revenue for Actual Period or Calculate Recognizable Revenue for Actual Period.
- Display Recognized Revenue: By default the Displayed Recognized Revenue is unselected. When selected, the Recognized Revenue row on the Forecast View on the Project will be displayed based on the following options: Manual, Total Only or Recognized Revenue by Labor and Expense
- Display Deferred Revenue: By default the Display Deferred Revenue is unselected. When selected, the Deferred Revenue row on the Forecast View on the Project will be displayed.
- Display Margin Section: By default the Display Margin Section is unselected. When selected, the Margin section will be displayed in the Financial Planner grid. You can choose to have all or some of the following displayed in the Margin section: Margin Total, Margin Percentage by Revenue, Margin Percentage by Cost, Margin Detail by Section and Category, Margin Percentage by Category by Revenue, Margin Percentage by Category by Cost, Net Margin and Net Margin Percentage
- Display Total Column: Choose whether to display the Running Total Column or the Total Actual Column
- Auto Populate Non Labor Forecast Data: When selected the Non Labor Forecast or Actual Data will be Auto populated by default. Upon clearing the selection, only the Actual Data will be auto populated.
Note: The Auto Populate Non Labor Forecast Data is selected by default.
- Display Financial Summary: By default the Display Financial Summary option is unselected. When selected, the Financial Summary section is displayed above the Budget Summary section (if shown) with the following information if they are selected to be displayed:
- Total Time: Dependent on the displaying of the Time category.
- Total Cost: Dependent on the displaying of the Cost category.
- Margin Total: Dependent on the selection of Margin Total in the Display Margin Section within View Settings.
- Margin Percentage by Revenue: Dependent on the selection of Margin Percentage by Revenue in the Display Margin Section within View Settings.
- Margin Percentage by Cost: Dependent on the selection of Margin Percentage by Cost in the Display Margin Section within View Settings.
- Net Margin: Dependent on the selection of Net Margin in the Display Margin Section within View Settings.
- Net % Margin: Dependent on the selection of Net % Margin in the Display Margin Section within View Settings.
- Display Budgets: By default the Display Budgets option is unselected. When selected, the Project Budget information will be displayed on the Financial Planner.
Upon turning the Display Budgets option on, you can then select to call attention to the Grand Total Time, Grand Total Cost and the Grand Total Revenue if the amounts do not match their respective Budgets. Select the respective boxes against each of the following settings and then choose a background color for each from the color picker:- Color Grand Total Time if not equal to Total Current Time Budget
- Color Grand Total Cost if not equal to Total Cost Current Budget
- Color Grand Total Revenue if not equal to Total Billable Current Budget
- Select the Display Probability Realization option to add the Probability in the Financial Planner allowing you to enter a percentage value per period. You can then run reports in Upland Analytics.
For more information refer to the following articles: