Updates to the Fast Feedback Dashboard
Over the coming months you may notice a new menu option in your Fast Feedback dashboard as we roll out 'Dashboard 2.0'.
This new dashboard includes:
-
A change to the overview layout.
-
Dedicated tabs to replace the main panel.
-
A new main menu design.
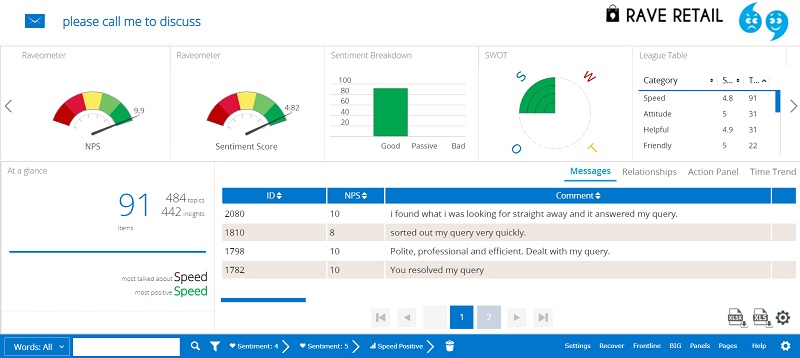
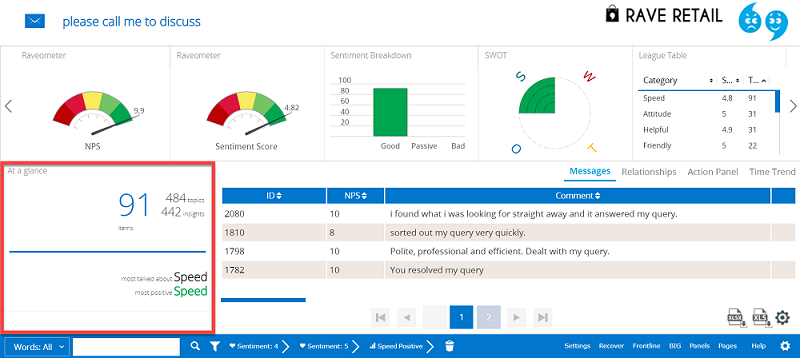
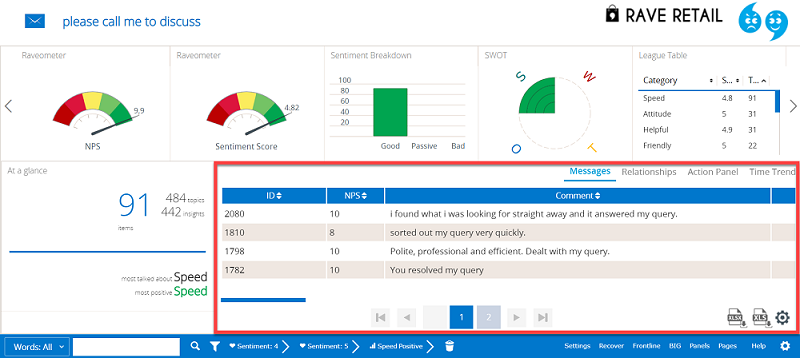
Current dashboard:
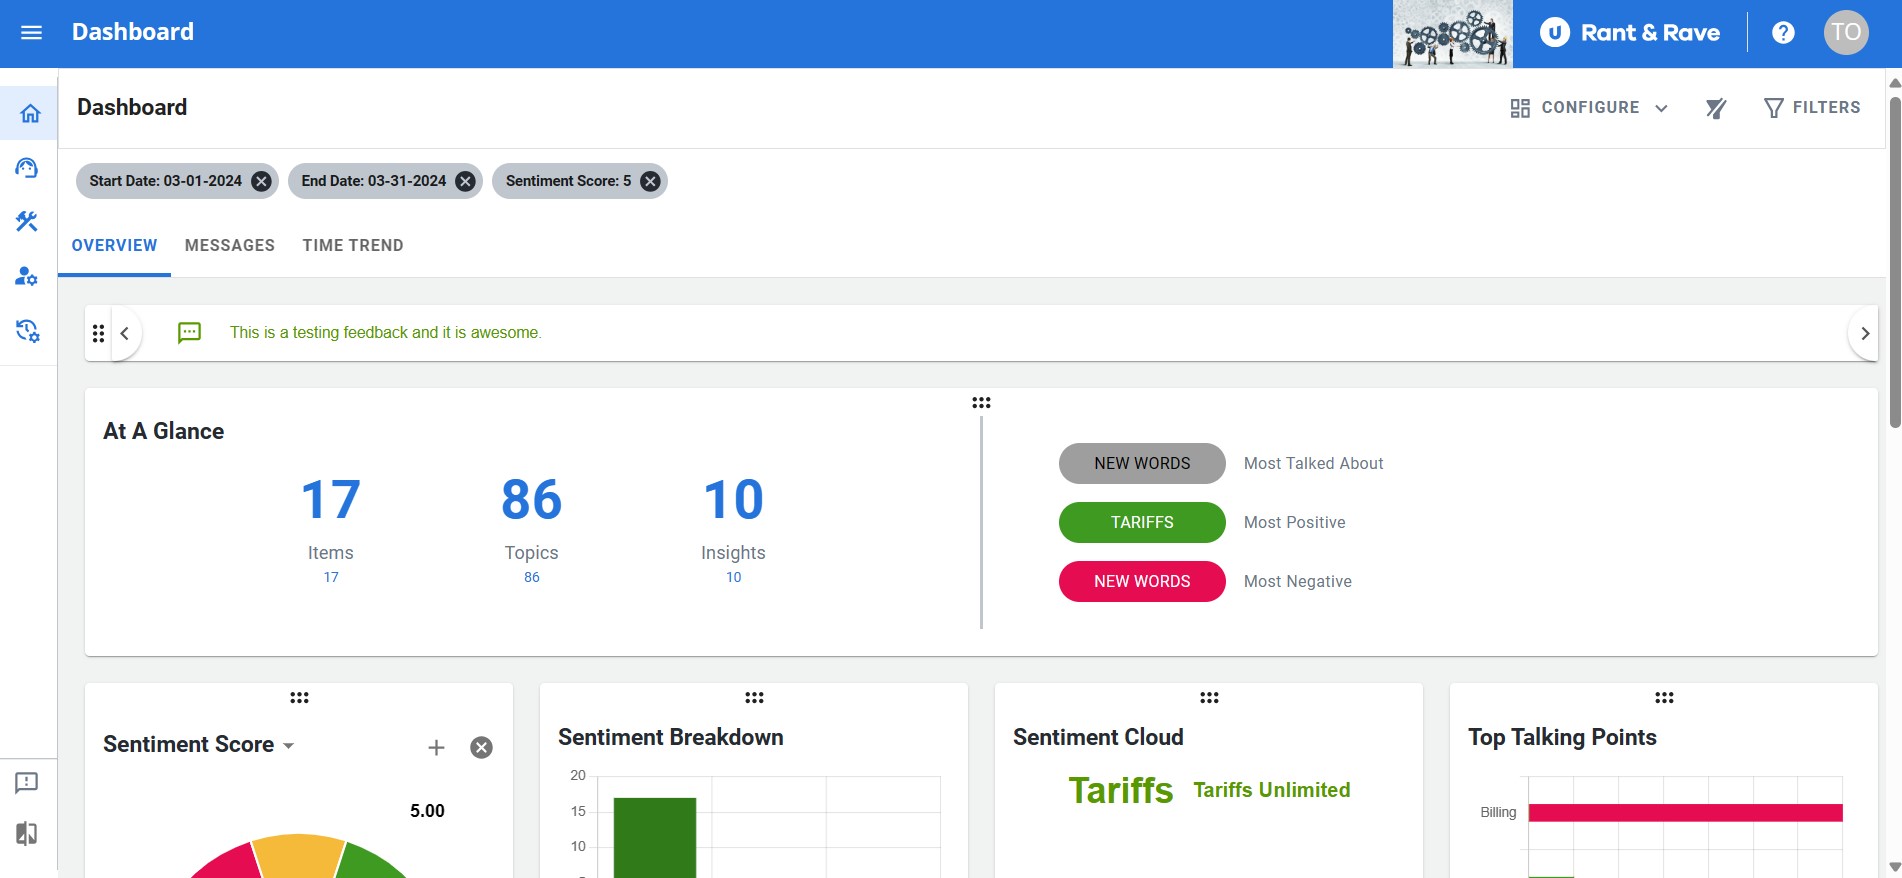
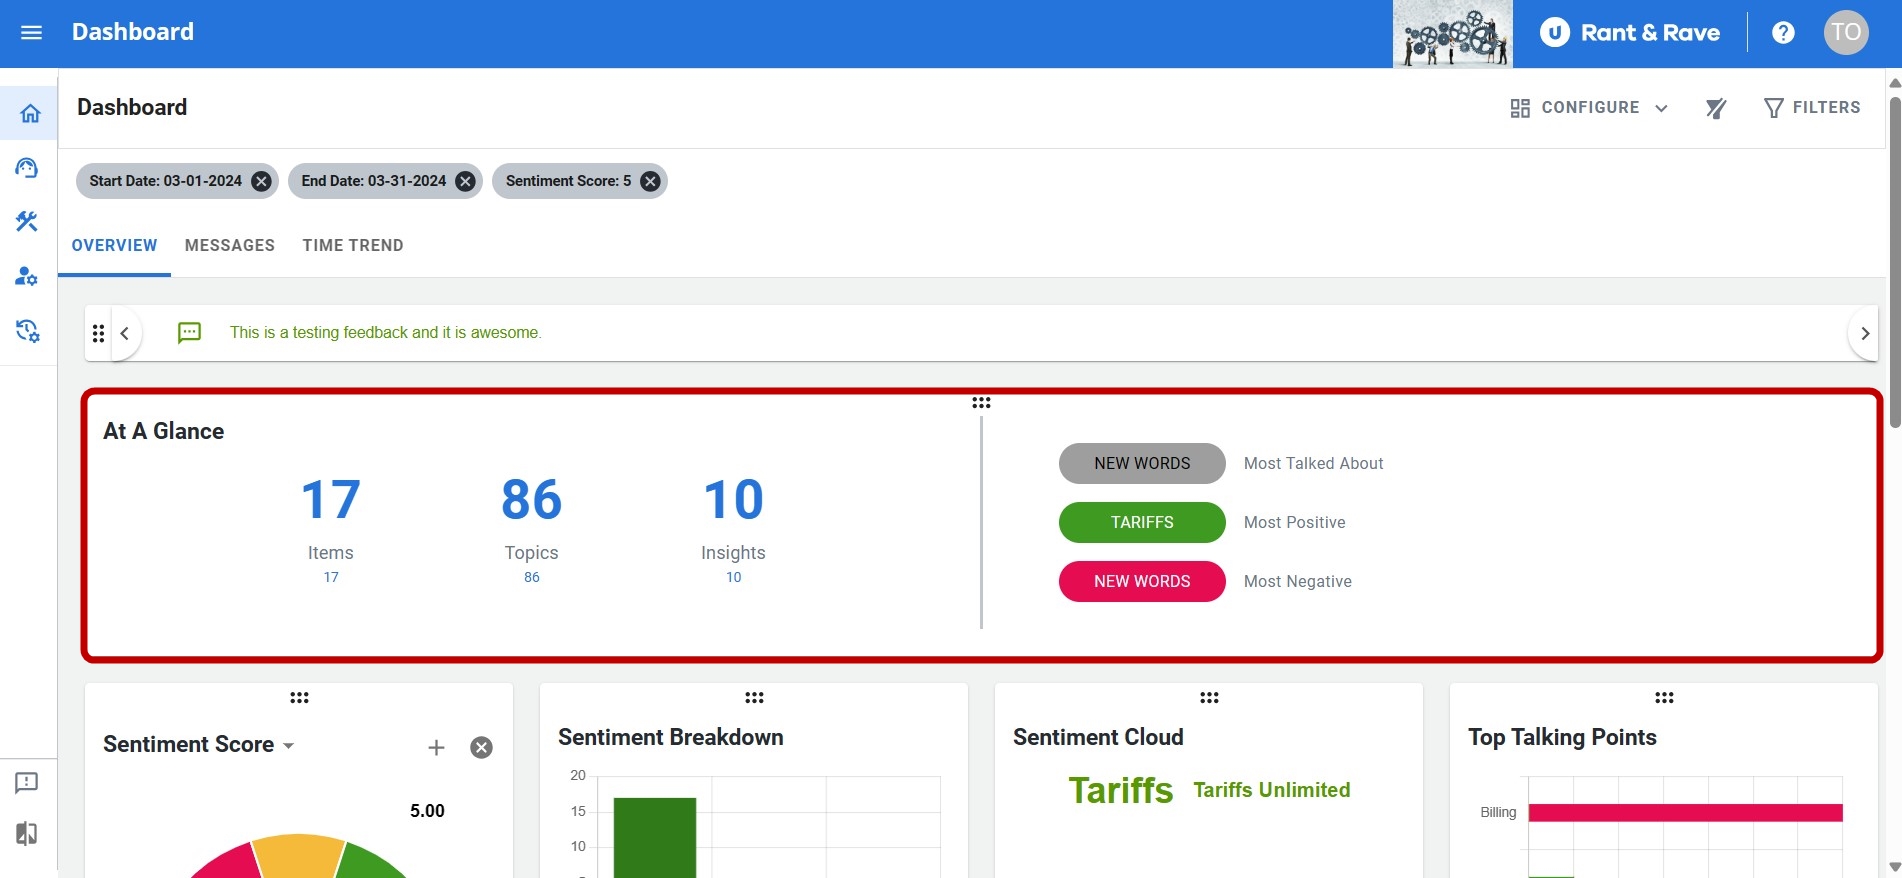
Dashboard 2.0:
During the initial roll out, you will be able to switch between dashboard views and continue using the view settings as defined in the Get to know your Fast Feedback Dashboard article.
Overview tab
Upon signing into the Rant & Rave service, you will be presented with the overview tab by default. Similar to the existing dashboard, the overview tab includes the message ticker, widgets/gadget slider, and the at a glance pane. However, the main panel for your messages, relationships, etc. has been relocated.
Message ticker
The message ticker remains at the top of your overview tab. However, the overview tab is now nested below and to the right of components from the dashboard menu in the current dashboard.
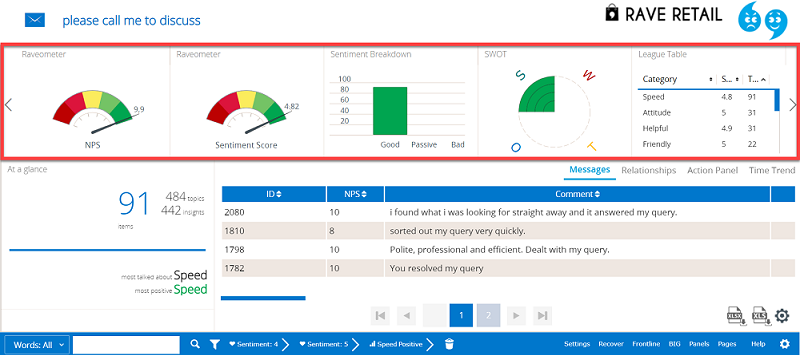
Location of the message ticker on the current dashboard:

Location of the message ticker on Dashboard 2.0:
At a glance panel
Dashboard 2.0 expands the at a glance panel and positions it above the widget collection (formerly the gadget slider) and it can also be relocated anywhere on the dashboard screen.
Location of the at a glance panel on the current dashboard:
Location of the at a glance panel on Dashboard 2.0:
Gadget slider
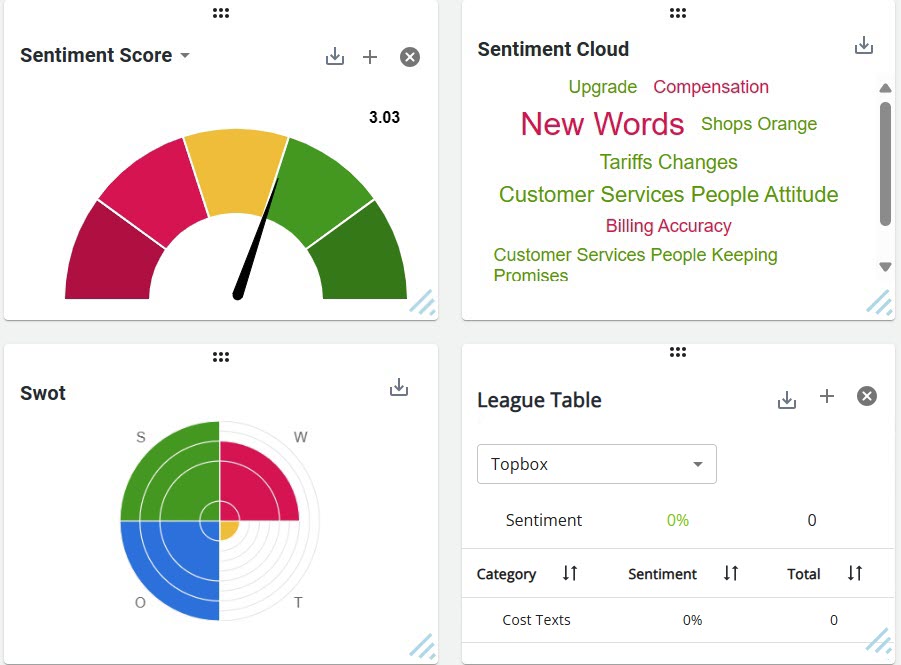
Dashboard 2.0 replaces the gadget slider with individual widgets, arranged below the at a glance panel. Instead of scrolling left/right on the slider, you can view other widgets by scrolling up/down on the dashboard. The gadgets can be resized and reordered on the screen, and you can configure which gadgets to display.
Location of the widgets on the current dashboard:
Location of the widgets on Dashboard 2.0:
Scroll down using the bar to the right of the dashboard to view more widgets.
Main panel
Dashboard 2.0 separates the main panel and the overview tab by moving the menus contained in the main panel to dedicated tabs on the dashboard.
Location of the main panel on the current dashboard:
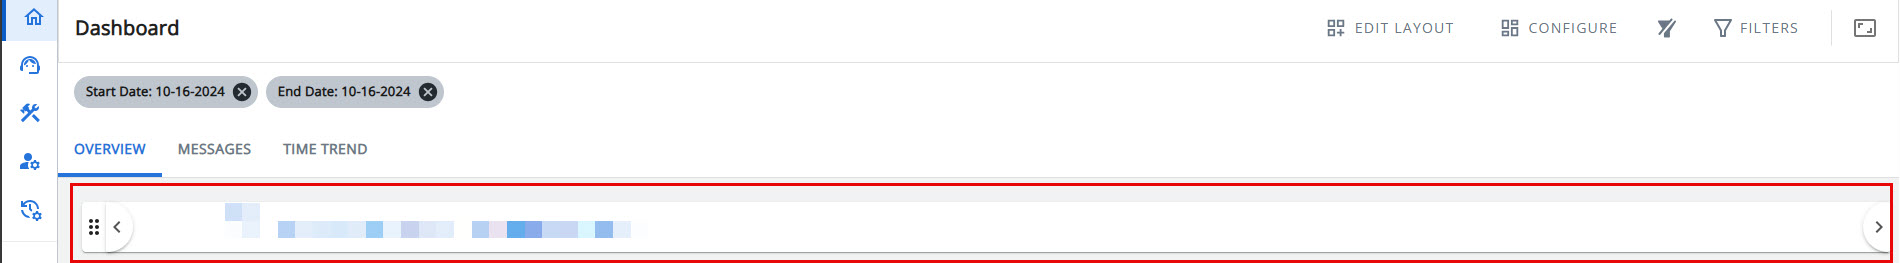
Location of the tabs that replace the main panel in Dashboard 2.0:
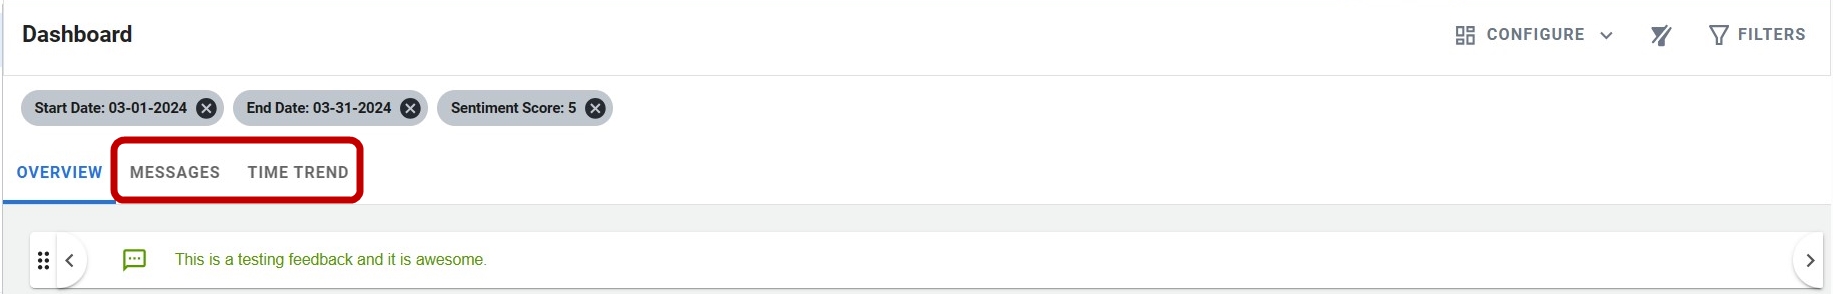
Select one of the tabs to view content that would have been presented in the main panel in the current dashboard, e.g. view how your feedback and scores change over time by selecting the time trend tab.
Note: At launch, only the messages tab is available. Functionality for the time trend tab is to be added in subsequent updates.
Menu bar
Dashboard 2.0 separates the current menu bar into two menus - the sidenav menu and the filter menu.
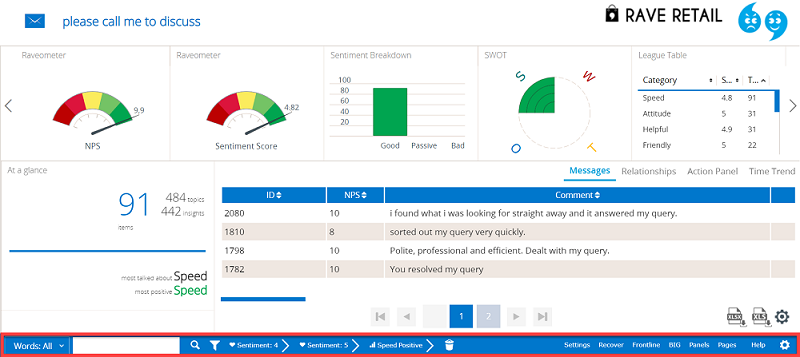
Location of the menu bar on the current dashboard:
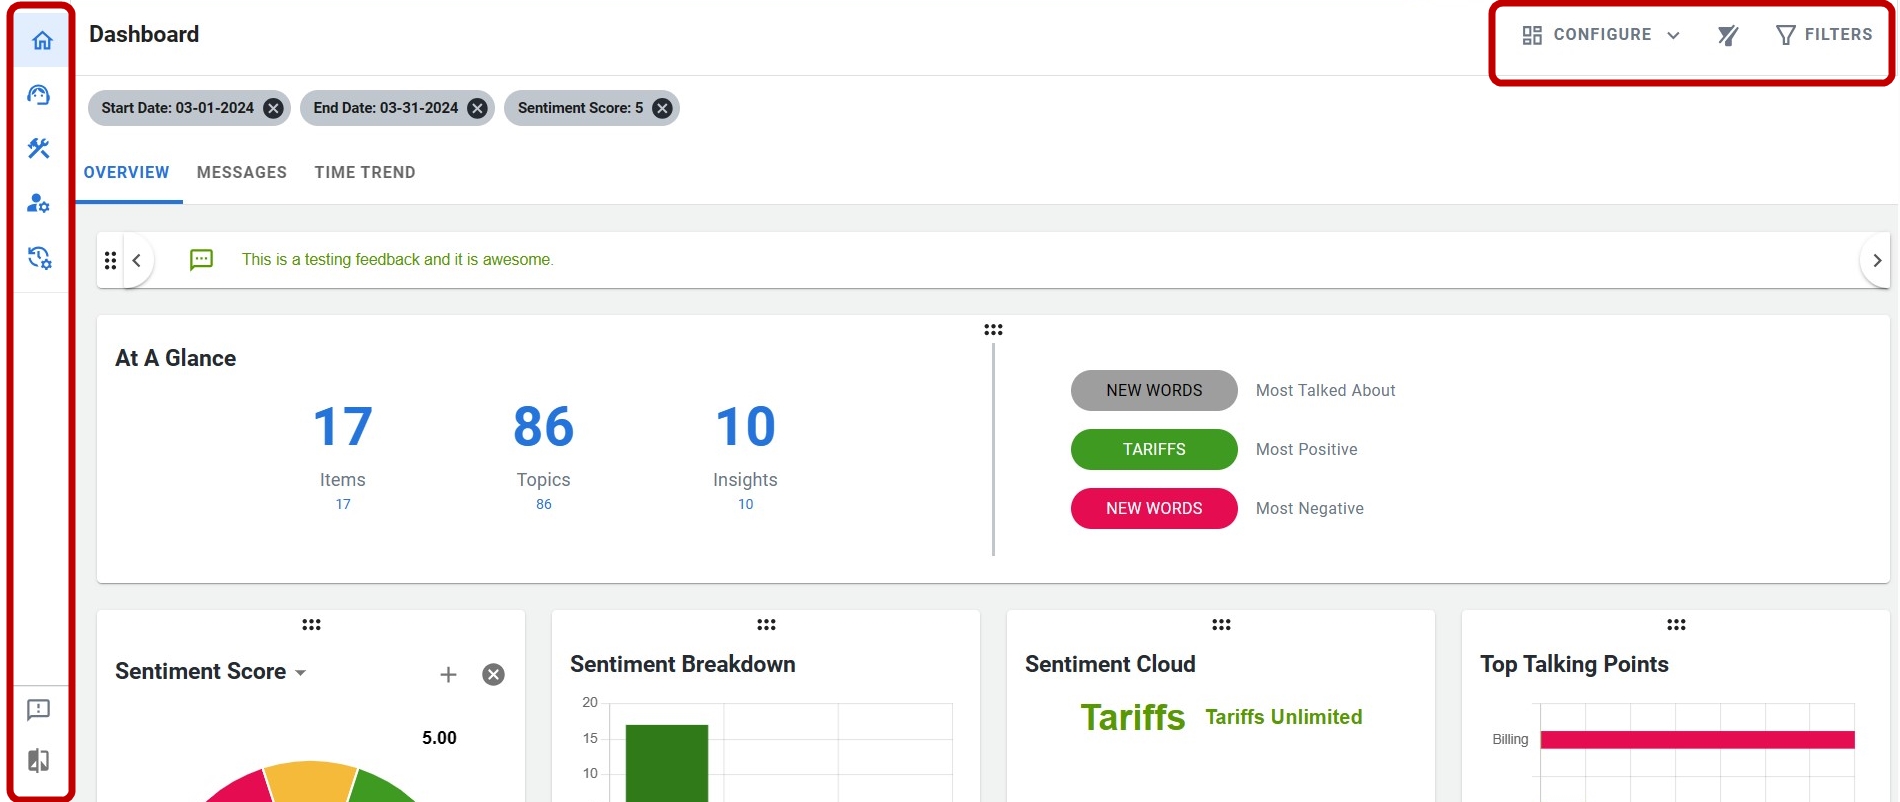
Location of the sidenav and filter menus on Dashboard 2.0:
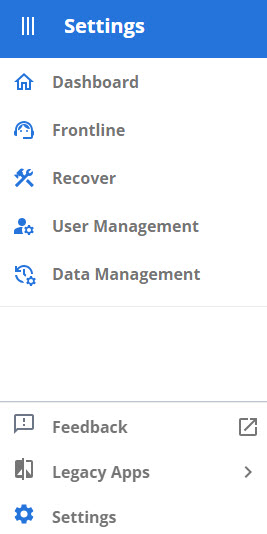
Sidenav menu
The sidenav menu provides links to your licensed modules and administration functions (previously accessed on the right-hand side of the menu bar). Click the hamburger icon to expand the menu.
Modules intended for managing your communication and feedback, e.g. Recover, will appear at the top of the sidenav menu. Modules intended for administrative tasks, e.g. Data Management, will appear under system management at the bottom of the menu.
The logout functionality is no longer accessed via the main menu and is instead accessed by selecting your user icon in the top right of the screen.
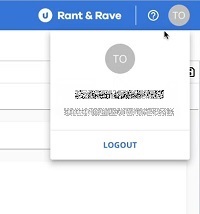
Next to the user icon is a question mark icon that takes you to the help center.
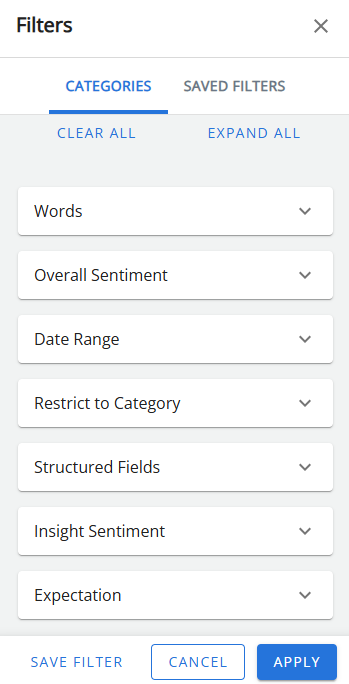
Filter menu
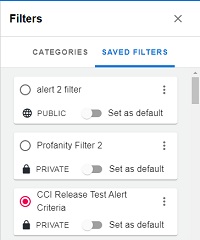
Access the filter options by selecting the filter icon to expand the menu. You can select filter options from the drop down menus in the categories tab or select saved filters from the saved filters tab.
Saved filters can be set to private or public. You can also select one of your saved filters to be a default filter that is applied upon logging in.
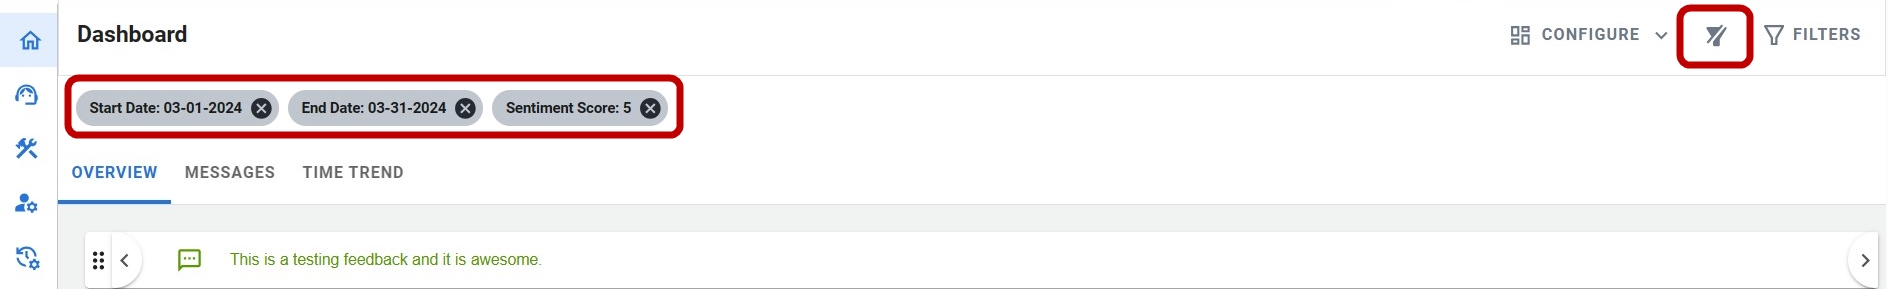
Applied filters are displayed at the top of the dashboard (above the tabs). Clear applied filters using the icon to the right of the applied filters list.