Upland Analytics 2020 R1.1 - Release Notes
This topic describes the new features and functionality and resolved issues as of Upland Analytics 2020 R1.1.
Story
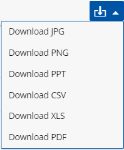
You can export a chart by clicking  on the menu bar and selecting the file format from the drop-down menu.
For more information see Download a Report or Graph/Chart.
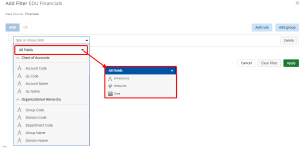
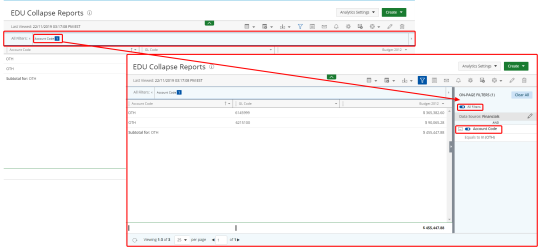
You can now add "and/or" rule or group filters to On-Page Filters.
Click  to open the On-Page Filter Drawer and then click
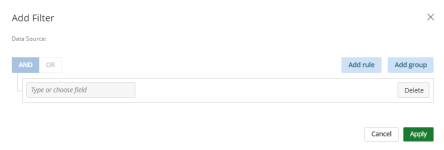
  in the On-Page Filter Drawer. The new Add Filter dialog box displays.
For more information see Apply an On-Page Filter (Report, Graph, Chart) or Apply an On-Page Filter (Dashboard).
We have made several changes to the Filter and On-Page Filter modals. Specifically:
- The filter icon
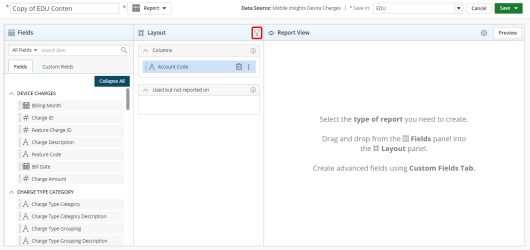
 has been added to the report and graph/chart Report Builder.
 - The On-Page Filter settings icon has been moved from the Settings modal for reports and graphs/charts to the Report/Dashboard Editor.
- The Add Filter modal has been added to create and/or rule and group filters.
- Ability to filter fields to display only fields with a desired field type in the Type or choose field drop-down column.
- You can only create dashboard On-Page Filters by data source.
When you click this icon, the Add Filter modal displays.
When you click ![]() the Add Filter modal displays.
the Add Filter modal displays.
For more information see Apply an On-Page Filter (Report, Graph, Chart) or Apply an On-Page Filter (Dashboard).
An Email List is a collection of contacts. It provides an easy way to send subscriptions to a group of people. For example, if you frequently send subscriptions to the marketing team, you can create an Email List that contains the e-mail addresses of everyone on that team.
To create an Email List, click ![]() on the Upland Analytics Icon Bar and then click Email Lists. The Email Lists page displays.
on the Upland Analytics Icon Bar and then click Email Lists. The Email Lists page displays.
For more information see Create an Email List.
Customer Request
See [UA-6670/6847/7146] in the Stories section.
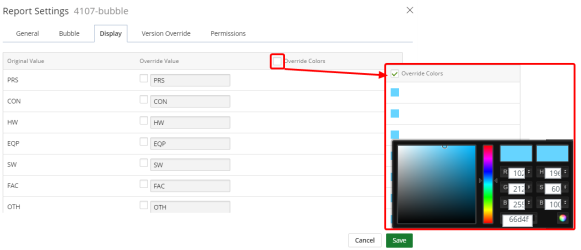
The new Display tab has been added to the Bubble Graph Settings. Use this tab to override colors on bubble charts.
For more information see Bubble Graph Settings.
When creating a text function to concatenate fields, users can now enter a comma. For example:
For more information see Create or Edit a Text Function.
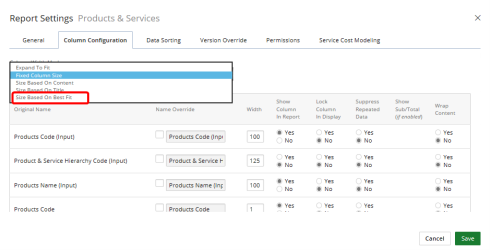
The new option, Size Based on Best Fit has been added to the Column Width Mode drop-down menu in the Report Settings. Select this option to automatically format the column width to fit the text.
For more information see Report Settings.
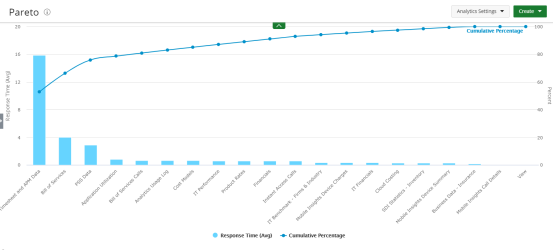
The new Pareto chart ![]() is now available with this release.
is now available with this release.
A Pareto chart contains both bars and a line graph, where individual values are represented in descending order by bars, and the cumulative total is represented by the line.
For more information see Create a Pareto Chart.
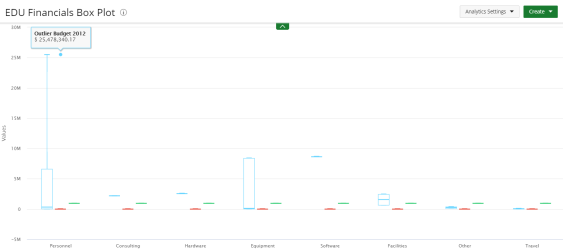
The new Box Plot chart ![]() is now available with this release.
is now available with this release.
A box plot chart presents information from a five-number summary. It does not show a distribution, but is especially useful for indicating whether a distribution is skewed and whether there are potential unusual observations (outliers) in the data set. Box plots are also very useful when large numbers of observations are involved and when two or more data sets are being compared.
Box plots are ideal for comparing distributions because the center, spread, and overall range are immediately apparent.
Note: Rules are not configurable.
For more information see Create a Box Plot.
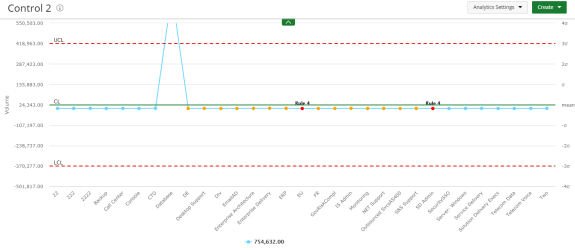
The new Control chart ![]() is now available with this release.
is now available with this release.
Use control charts to filter out the probable noise (inherent variation or common cause) from the potential signals (nonrandom variation or special cause). From this, you know when and where to take action on a process.
For more information see Create a Control Chart.
Resolved Issues
- [UA-5691] - You can now successfully add an Average function column to a pivoted report.
- [UA-5692] - You can now successfully apply an average custom field to a pivoted measure field in a report and Pivot report.
- [UA-6166] - The correct output is now received when a Pivoting formula references another formula.
- [UA-6412] - The Resize functionality on a dashboard now works correctly for KPI values.
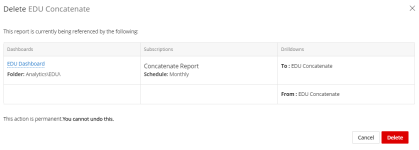
- [UA-6593] - When deleting dashboards, the warning message now displays the correct dashboard.
- [UA-6628] - You are now able to successfully save and send a report using the Save & send by email option.
- [UA-6707] - You are now able to successfully edit custom fields.
- [UA-6716] - You are now able to successfully show selected top or bottom rows on a report.
- [UA-6816] - The Save button is now disabled when attempting to add the same permission (i.e., Can View and Can View & Edit) to a user.
- [UA-6882] - The Display tab now displays correctly when downloading a report and graph/chart.
- [UA-6941] - You can now successfully download a dashboard in IE 11.
- [UA-7047] - Dashboards now successfully load.
- [UA-7054] - Reports with Pivoted Dimension custom fields now successfully load.
- [UA-7071] - When hovering on a Gantt chart's bar, the information pop-up now successfully overrides the names of the columns.
- [UA-7174] - MDX - Internal filters are now being applied.
- [UA-7200] - Pivot - You can now successfully create a Pivot report.
- [UA-7215/7271] - The UI issue received on email and my settings popup windows has been resolved.
- [UA-7292] - The Concatenate function now works correctly.
- [UA-7407] - You can now successfully pivot by Created On field on the Analytics Usage Log.
- [UA-7448] - You can now successfully create a pivot on a measure.
- [UA-7488] - Reports with pivoting formulas now successfully load.
- [UA-7498] - You can now successfully save and send charts by email.
- [UA-7509] - You can now successfully create a text field that is based on another custom field.
