2021 R1.0 - New Features
Below is a summary of the features included in the Upland Analytics 2021 R1.0 release.
Enhanced custom number formatting
You can now format numeric values (numbers and currency) in millions (M) and thousands (K) and round numbers. This helps when working with large numbers. For more information, see Change the numeric or week format on a report, graph/chart.
New message returned when a report or graph/chart is loading
When a report or graph/chart is taking time to load, we have modified the message to Your report is loading. If you're in a hurry, you can have the report sent to you via email or cancel to stop loading. Click email to send the report or graph/chart in an email or cancel to stop the loading process.
On-Page Filters option has been removed from the Settings modal
The option to select On-Page Filters from the Settings modal has been removed. You must modify On-Page Filters in the filter drawer. For more information, see Apply an On-Page Filter.
Ability to successfully delete a dashboard set as your home page
When you delete a dashboard that is set as your home page, your home page is reset to the default.
New option to save On-Page Filter values at the user level
You are now able to save On-Page Filters to the report/graph/chart or dashboard. For more information, see Apply an On-Page Filter.
Improved validation messages in the custom field builder
Meaningful validation messages are now displayed in the custom field builder to help you debug your custom fields.
User Group level security has been added to UA folders
You can now share folders by user groups.
Ability to define new user role groups and configure permissions related to the Access Control List (ACL)
A new administrative option has been added to allow you to add new roles that can be mapped with other Upland products with permissions related to the Access Control List (ACL). For more information see Access Control.
Ability to successfully export a dashboard to a PPT and PDF File
You must now wait until the dashboard is fully rendered before you are able to export it to a PPT or PDF file.
Ability to control the number of pages of records to display on reports
You can now change the default number of pages of records to display on reports by user and company. The default is 50. The Lines Per Page option has been added to My Settings (your profile) for users and to Analytics Settings (Admin access only) for company. For more information, see My Settings and Analytics Settings page.
User Roles page has been renamed to User Groups
The User Roles page found in the Administration list in the User Management drop-down menu has been changed to User Groups. For more information, see Administration.
New Upland Analytics
In this release, we're introducing you to the New Upland Analytics. The New Analytics is designed to help you organize and view all of your reports and dashboards in a slicker more intuitive interface.
Note: You must contact your customer support team member to request that the New Upland Analytics be enabled.
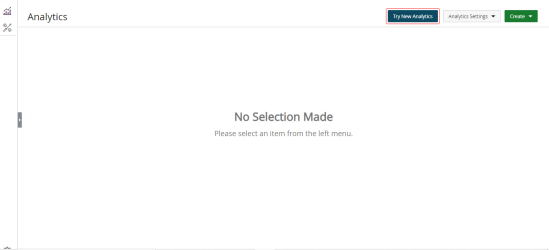
Click the Try New Analytics button to open the New Analytics and take the tutorial.
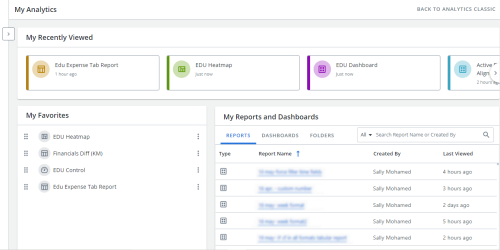
On the New Analytics home page, you can easily see your most frequently used reports and dashboards and manage your favorites list. To go back to Classic UA, click Back to Analytics Classic.
You can use the versions interchangeably, they point to the same database. However, in New Analytics you can only do the following:
-
view reports, graphs/charts, and dashboards
-
apply filters, if filters have been set up
-
download reports, graphs, charts, and dashboards
-
send the reports, graphs, charts, and dashboards in an email
-
view dashboards in presentation mode
To access the New Analytics help project, click this link: New Analytics help project or click the help button in New Analytics.

