Resource Histogram Report
The Resource Histogram report provides a visual representation of Resource allocation and actual time over a specific time period for a selection of Projects and Resources.
Each report will include a Resource Histogram chart that gives the reader a high-level view of allocated and actual Resource time spread out over a period. Report viewers can filter the Projects and Resources that are included in the report.
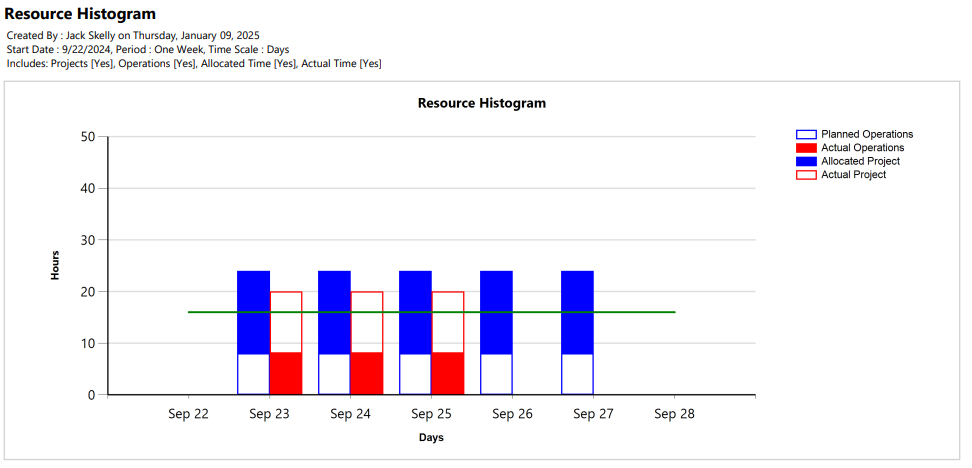
In the simple example above, only two Projects (or one Project and one Operation) have been included. Also, only two Resources have been included: Brady and Josh. The time period is set to a single week.
As explained by the legend in the top right-hand corner, the planned/allocated total time is represented by the blue bars and the actual total time is represented by the red bars.
Note: Allocated time is referred to as "planned time" for Operations.
Additionally, there is a horizontal green line that represents the total time available. In this example, there are only two Resources included. The calendar is set for 8 working hours each day. Therefore, the horizontal line is set at 16 hours because that is the total availability for both Brady and Josh.
All of the blue bars extend beyond the green availability line on each day. This means that Brady and Josh have been collectively overallocated on each day this week. Also, the red bars extend beyond the green availability line from Sep 22-25. This means that Brady and Josh have collectively worked more than their availability on each of these days. Both Sep 27 and 28 do not contain any red bars because neither Brady or Josh has entered any time for those days.
Note: Remember that actual time is calculated through Timesheet entries.
Below the Resource Histogram chart, report readers may see tables that break down the allocated and actual time for each Project and Resource included in the report.
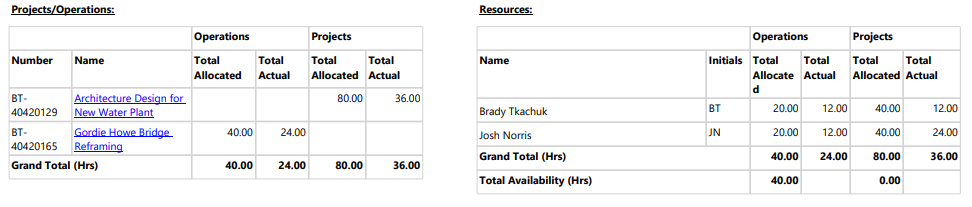
For simplicity, the example above only includes a couple of Projects and Resources. In reality, Histograms are often used to monitor a large number of Projects and Resources at once to assess Resource utilization, identify bottlenecks (when Resources are working at full capacity but still unable to meet demands), and ensure that Resources are allocated efficiently.
To run the Resource Histogram report:
Before You Start: Users will require the "Resource Reports - Allow" permission from an Application Policy to run this report. Additionally, users will require the "Profile Details - View" permission on at least one of a Project's Policies in order to view the Project's data in the report.
-
Select the Reports icon
 from the Navigation Menu.
-
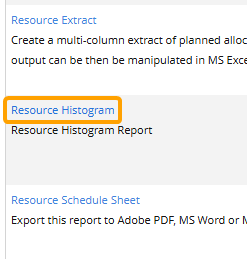
Select Resource Histogram from the list of Eclipse Reports.
-
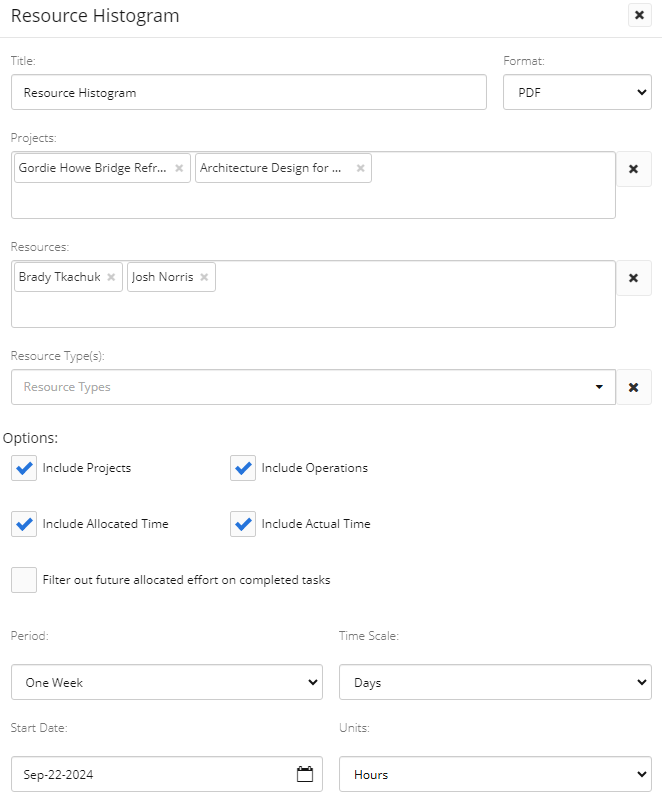
Use the "Resource Histogram" window to customize your Resource Histogram report.
-
Title: Enter a custom name for your Resource Histogram report. This title will appear at the top of the report.
-
Format: Determine whether the report will be downloaded as a PDF file, a Microsoft Excel file, or a Microsoft Word document.
-
Projects: Select which Projects will be included in the report by typing in the name of a Project or Project filter and selecting it from the drop-down menu. Repeat this until all of your desired Projects and filters have been added.
Note: These are the same Project filters that can be found on the Project Search page. From here, users can create their own custom Project filters that can be used in the report.
Note: A message will appear if the selected filter(s) will result in no Projects being included in the report.
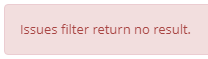
This could be the result of selecting a filter (or multiple) that does not include any Projects. It could also occur if the user running the report does not have permission to view any of them. -
Resource: Select which Resources will be included in the report by typing in the name of a Resource or Resource filter and selecting it from the drop-down menu. Repeat this until all of your desired Resources and filters have been added.
Note: These are the same Resource filters that can be found on the Resource Search page. From here, users can create their own custom Resource filters that can be used in the report.
Note: Resources that are not assigned to any Tasks on the included Projects will still be listed in the "Resources" table.
-
Resource Type(s): Select which Generic Resources will be included in the report by selecting the name of a Resource Type from the Organization Structure. Generic Resources that are assigned to the selected Projects/Operations will be taken into account on the Histogram chart and listed in the "Resources" table.
Note: Unlike Named Resources (a.k.a. actual individuals), adding Generic Resources to the report will not cause the green availability line to rise.
-
Include Projects: Select this checkbox to include Projects (not Operations) in the report. Deselecting the checkbox will automatically filter out any Projects.
-
Include Operations: Select this checkbox to include Operations (not Projects) in the report. Deselecting the checkbox will automatically filter out any Operations.
-
Include Allocated Time: Select this checkbox to include allocated/planned time (the blue bars) in the report. Deselecting this checkbox will exclude allocated/planned time from the Histogram chart as well as the "Projects/Operations" and "Resources" tables.
-
Include Actual Time: Select this checkbox to include actual time (the red bars) in the report. Deselecting this checkbox will exclude actual time from the Histogram chart as well as the "Projects/Operations" and "Resources" tables.
-
Filter out future allocated effort on completed tasks: If selected, any future allocated time toward a completed Task will not be included in the Histogram chart. It will also be excluded from the "Projects/Operations" and "Resources" tables.
Example: Brady is assigned to a two week long Task. He finishes it early on Friday and marks it 100% complete. The Resource Histogram is run on the same Friday, January 10th.
If this checkbox is not selected, the rest of his allocated time toward the completed Task on the following week will be included in the report.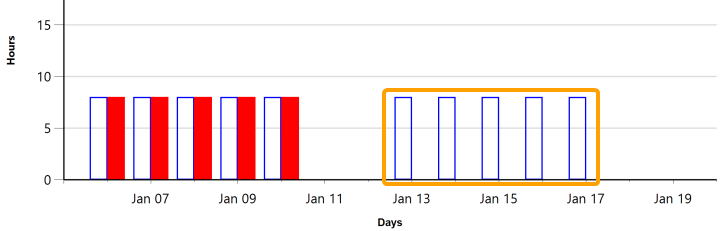
If the checkbox is selected, the allocated time toward the completed Task on the following week will not be included because it is allocated in the future.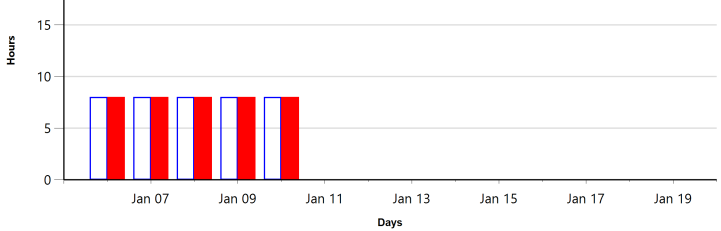
This future allocated time will also be excluded from the "Projects/Operations" and "Resources" tables. -
Period: Use the drop-menu to determine the amount of time covered by the report.
-
Time Scale: Use the drop-down menu to determine the units on the x-axis.
-
Start Date: Use the calendar to determine the start date for the time period covered by the report.
-
Units: Determine the units on the y-axis.
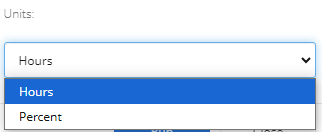
-
Hours: The time will be measured in hours.
-
FTE: The time will be measured in FTE (full-time equivalent).
-
-
-
Select the Run button.
After selecting Run, the report will automatically download onto your device in the selected format.