Audiences
Audiences provides you with the tools you need to manage your customers.
-
Organise your data into folders.
-
Build an audience selection using the Audience Workspace.
-
Create a Calculated Field from other fields in your data.
-
Perform Data Discovery using pivot tables.
-
Use a Data Template to create a field list for data display or export.
-
Build a new Data Banding on a data field.
-
Find the Intersection of your audiences using a Venn diagram.
-
Specify a Label to recognise groups in your data.
Getting started with Audiences
After you log in to Audiences, you will arrive at the Home page. Here you will be able to access the navigation menu and start creating.
Logging in to Audiences
From Adestra:
-
Use the App Switcher, or
-
Use an integrated function such as 'Create a list in Audiences'
To move between your Adestra and Audiences workspaces.
Navigating Audiences
Located to the left of the app, use the navigation menu to:
-
Search your data (magnifying icon) - locate an element within Audiences, e.g. find a calculated field.
-
Perform analysis (chart icon) - view or create analysis objects such as pivots, audience selections, etc.
-
View data (data stack icon) - see your database tables, fields, etc.
-
Create (plus icon) - opens the create window where you can select and create new elements.
Changing views in Audiences
Use the icons above the main workspace area to change the workspace view from a single function displayed at a time to side-by-side views or four quarter views.
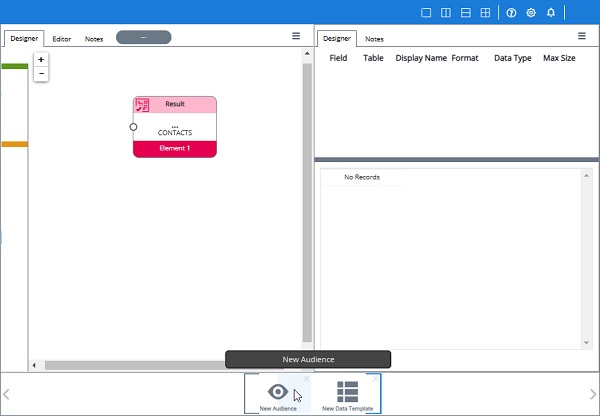
To rearrange the order of your elements when in split screen view:
-
Hover over an element in the bottom taskbar. The icon will become shaded on one side to represent an area of the workspace.
-
Select the shaded area to reposition the element in your workspace.
Tip: the line around the edge of the element indicates its current location on your workspace to aid in identifying each element.