Create a Report Wizard Report
The Report Wizard is a quick and easy way to build a report that you can view in PowerSteering or send to others via an automated scheduling option.
Tip: If you are interested in using the Report Wizard to create a Report that can be transmitted over a Secure File Transfer Protocol (SFTP) remote site, see Create a Data Extract Job.
1. Click Report Wizard
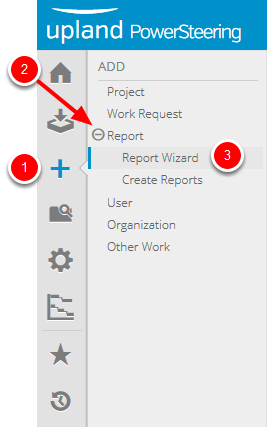
- On the Icon Bar click the Add button
- Click Report to expand the menu, then click ReportWizard.
2. View Report Wizard
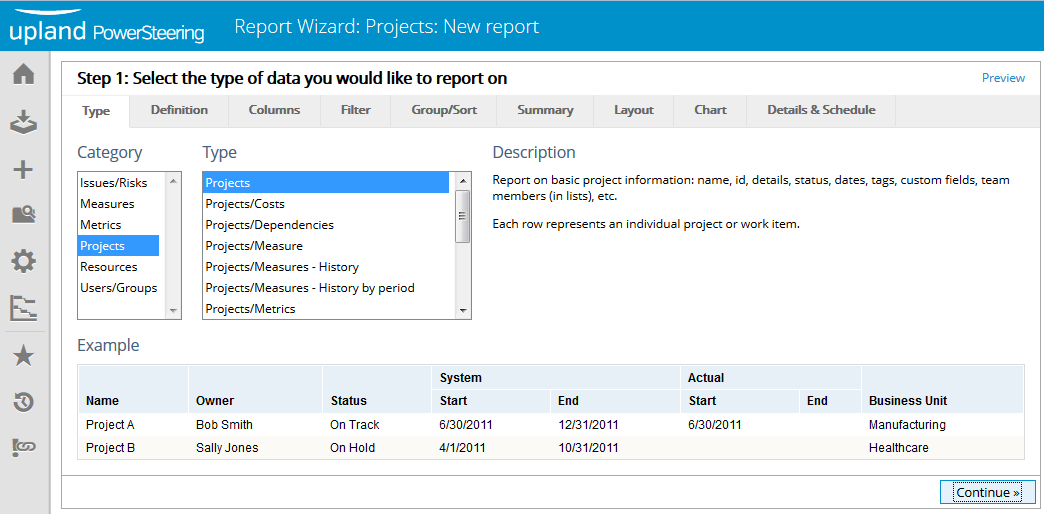
- The Report Wizard is displayed on the page.
Note: You can set the Report Wizard as a Favorite or Quick Link for faster access. You can read the articles How do I create a Favorites list? or How do I pin / unpin a Favorite to my Quick Links menu? to learn more about this.
3. Select a Report Type and Category
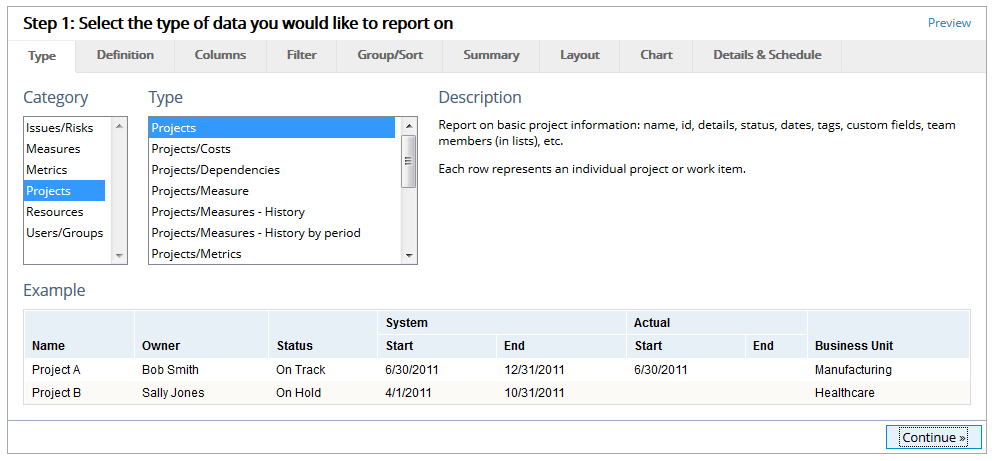
- Select a type and category for your report. See Report Wizard Type Tab for more information about this step.
4. Set Report Definitions
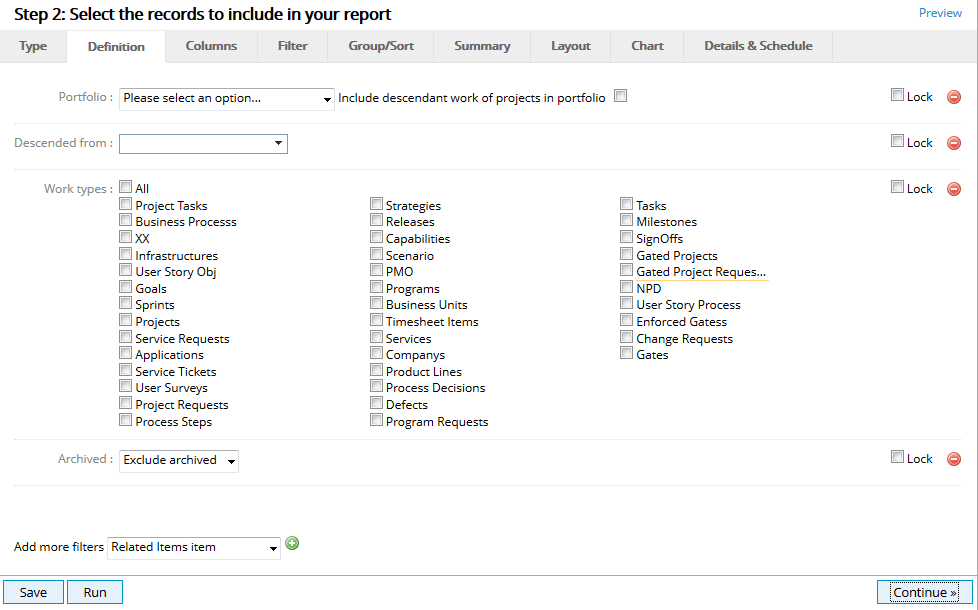
- Set the criteria for the data source for your report. You can limit data by selecting a specific portfolio, location(s) in the Work Tree or individual work types. See Report Wizard Definition Tab for more information about this step.
5. Select Columns
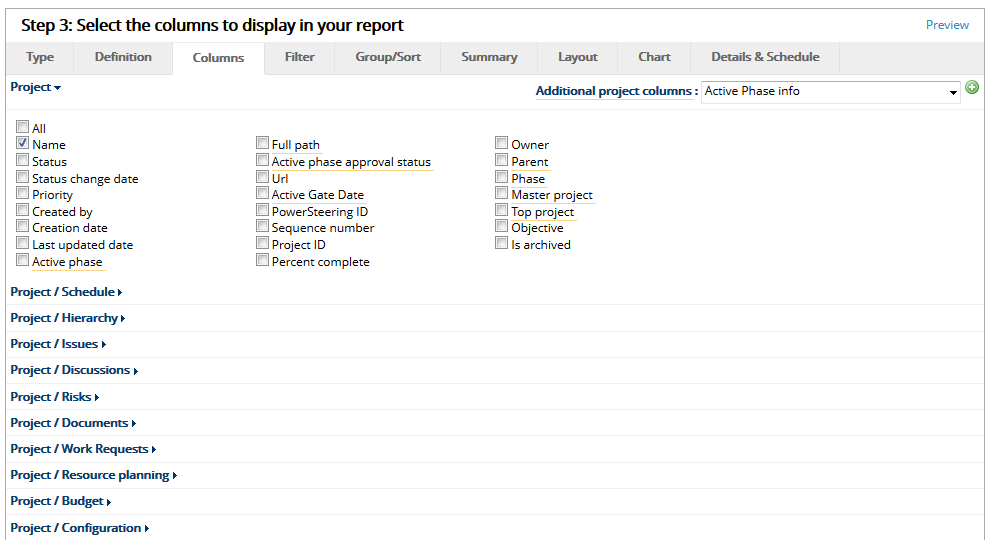
- Locate and select the columns you want displayed in your report. The columns that are available are based on the type and category you selected on the Type tab. See Report Wizard Columns Tab for more information about this step.
6. Set Filters

- Identify which columns in your report will be used as filters to limit the data. Once you select the columns you will set the specific criteria for that data. You can also select additional filter criteria for columns that will not be displayed in the report. See Report Wizard Filter Tab for more information about this step.
7. Select Group/Sort Options
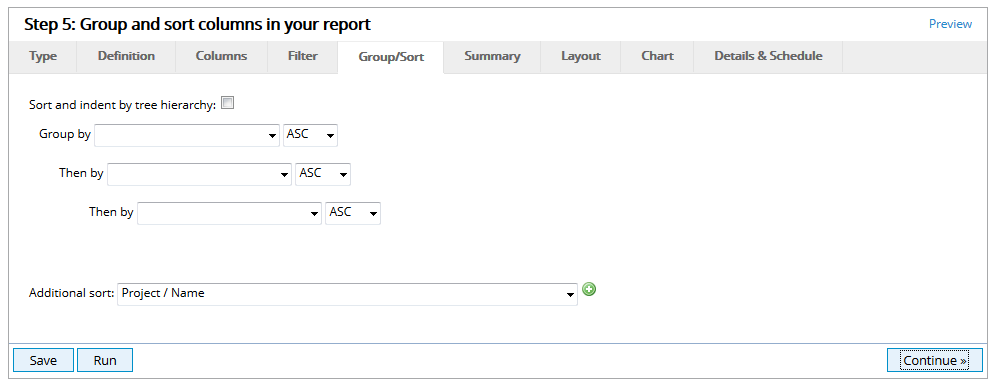
- Create new settings for groups and sorts on your data. You can add multiple groupings and apply a custom sort for tags that have special sequencing. You can also add additional sort criteria for columns that are not being displayed in your report. See Report Wizard Group/Sort Tab for more information about this step.
8. Add Summary Data
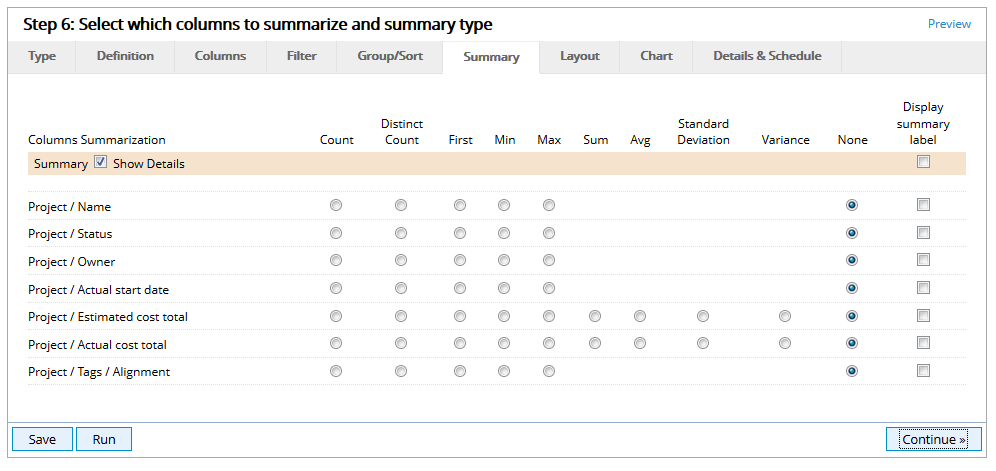
- Select which columns you want to display summaries for at the end of the column. If your report has groupings, you will have additional options to have a summary within a group. You can also add labels to your summaries. See Report Wizard Summary Tab for more information about this step.
9. Update Layout and Formatting
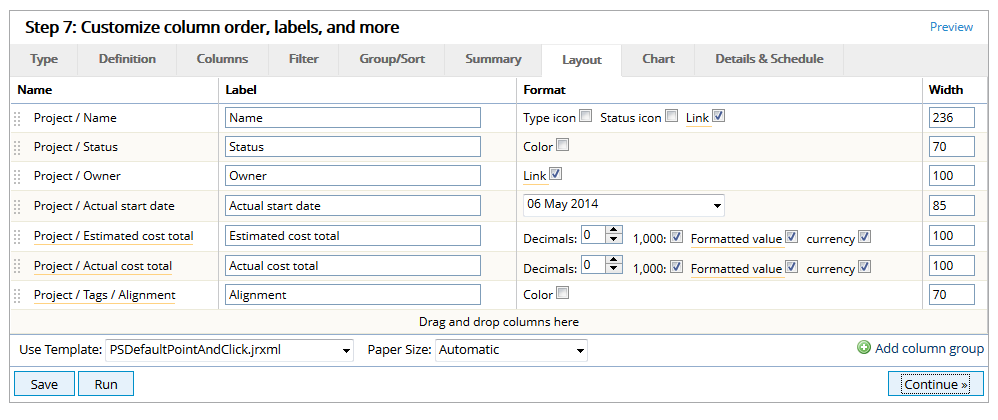
- This is where you can rearrange the order of the columns, rename a column heading, change the format and width of the data that is included in your report. See Report Wizard Layout Tab for more information about this step.
10. Add a Chart

- You can add a bar, line, pie or gauge chart to your report that will display above or below your data. Or you can opt to only show the chart and no data. See Report Wizard Chart Tab for more information about this step.
11. Save and Schedule Report
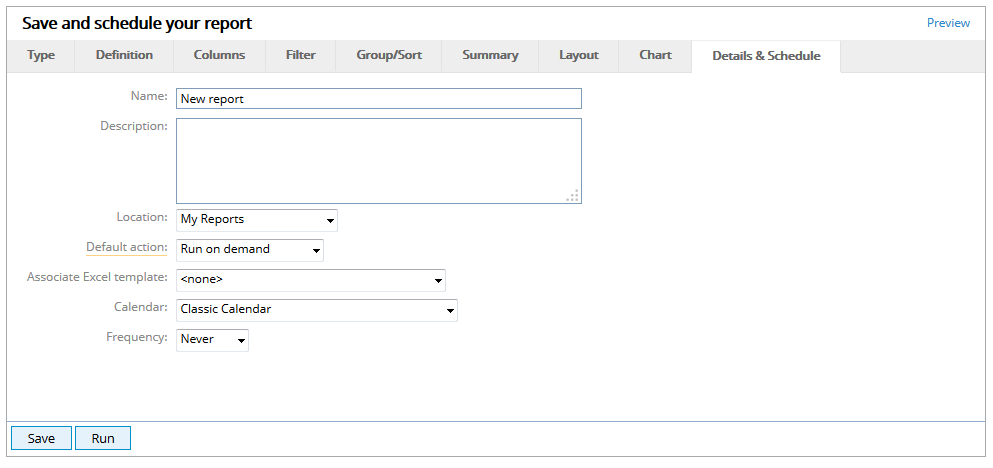
- From here you can save your report or create an automatic schedule to send on a specific frequency. You can schedule the report to be sent via email to individual PowerSteering users or groups, or use external emails separated by a comma. See Report Wizard Details & Schedule Tab for more information about this step.