Upland Analytics Update - UA2026R1.6
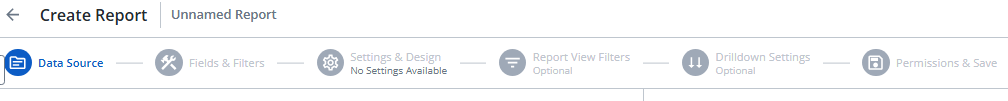
The new 2026R1.6 version of Upland Analytics will be released to staging sites on Wednesday, June 24th, 2026 and to production sites on Sunday, July 19th, 2026. This upgrade marks the culmination of a multi-year initiative to bring the modernized reporting capabilities of "NextGen" Upland Analytics to PowerSteering. Once this release has been deployed, the previous version of Upland Analytics (or "Analytics Classic") will no longer be available.
The "NextGen" Upland Analytics interface is designed to make exploring your data faster, clearer, and more intuitive. Whether you're tracking progress, spotting trends, or uncovering gaps, this modernized experience puts the reports, charts, and dashboards you rely on right at your fingertips. "NextGen" turns insights into action, with less clicking and more clarity.
To help you take full advantage of "NextGen" Upland Analytics, this page includes the following resources:
Significant Changes
A lot of things are different in this new version of Upland Analytics. Select any of the processes below to see how they have changed:
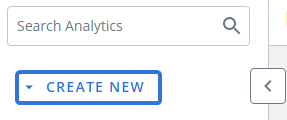
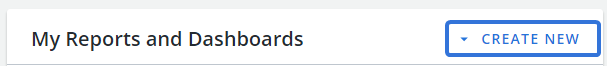
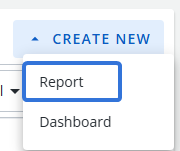
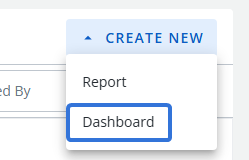
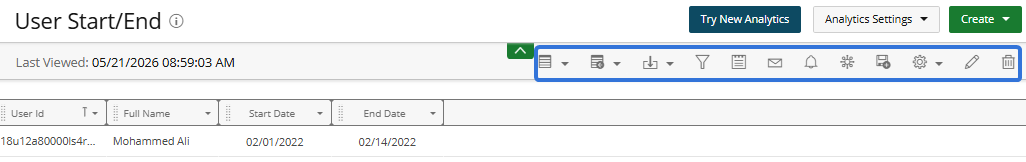
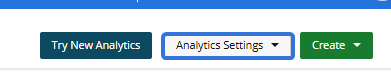
Prior to this release, the Create drop-down menu was located in the top right-hand corner of Upland Analytics.

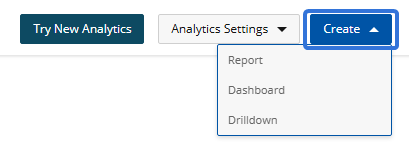
With this update, the drop-down menu can be accessed from either the new Analytics Menu or the "My Reports and Dashboards" table.

See Building Reports or Building Dashboards below for more information. Also, see Building Reports in "NextGen" Upland Analytics for a full walk-through on creating reports.
Prior to this release, Upland Analytics users had to build their reports first, then revisit them afterward to apply additional settings.
The "Report Settings" could not be accessed until the report was saved.
With this update, report building now follows a single, streamlined workflow. Users can configure settings (such as filters and formatting) during report creation, resulting in a more intuitive and seamless experience.
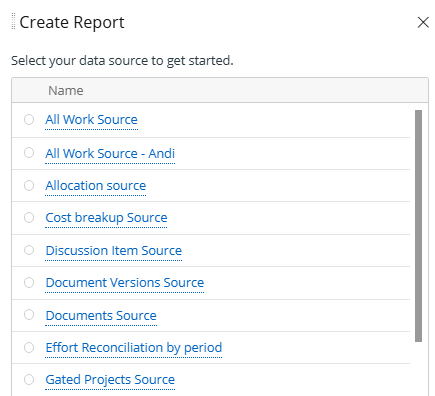
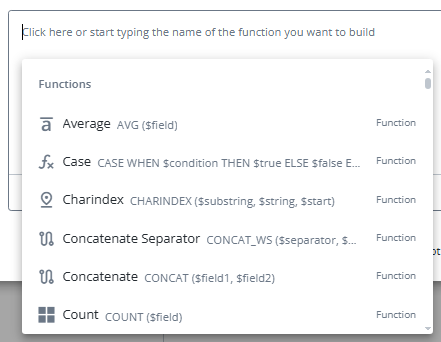
To start, simply select Report from the "Create New" drop-down menu.
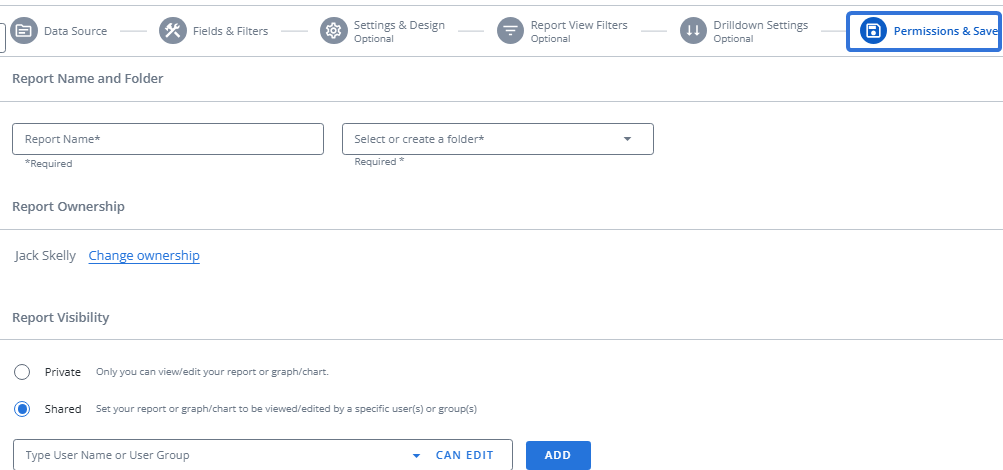
First, the “Data Source” tab allows users to select a Data Source from which the report will draw its data.
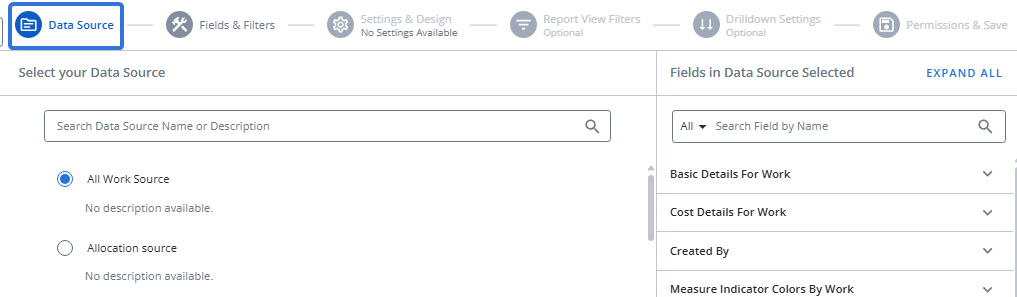
Tip: The views and fields available for the selected Data Source will be previewed on the right-hand side of the page. This allows report builders to ensure that they have selected the correct Data Source before moving on.
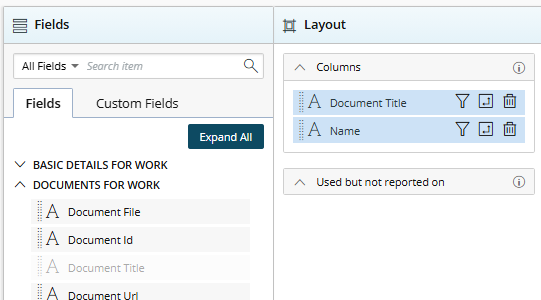
Next, users can select the Fields & Filters tab or the Next button to determine the fields that will be displayed on their report, as well as the report type. Just like in the legacy version, filters can be added to each selected field.
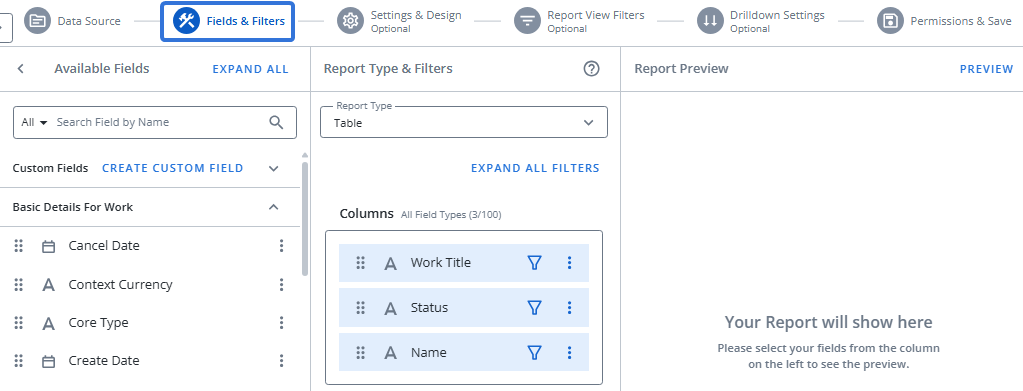
Tip: Select the Preview button in the top right-hand corner of the page to see what your report looks like with the selected fields and applied filters.
Note: Report builders can create Custom Fields for their report from this tab. See below for more information.
Note: Unlike in Analytics Classic, changing the report type will not erase all of your selected fields.
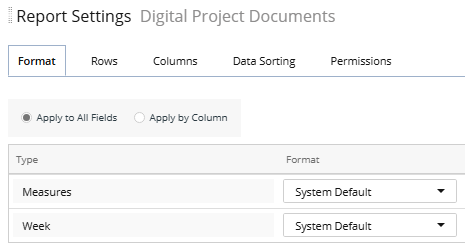
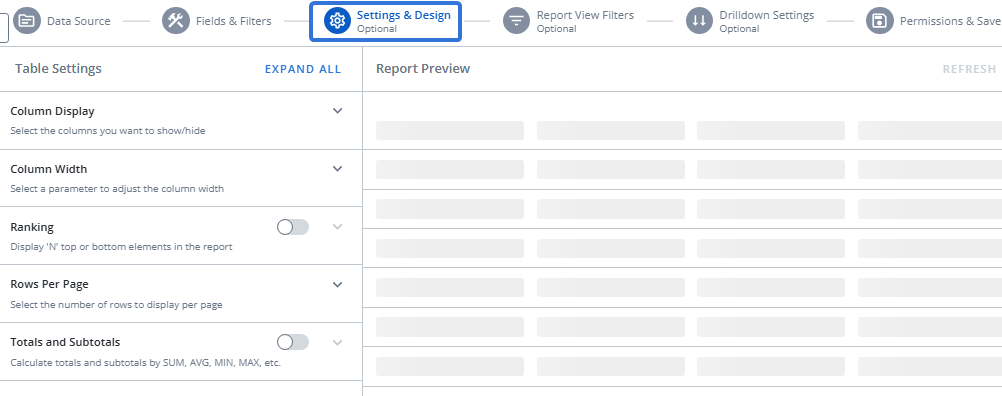
Next, users can select the Settings & Design tab to configure settings unique to the selected report type.
Next, users can select the Report View Filters tab to create any on-page filters that report viewers will be able to apply when they interact with your report.
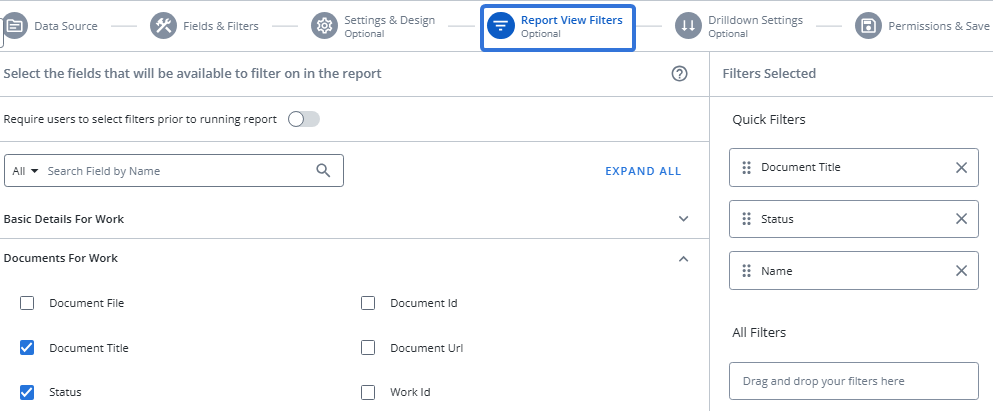
Tip: Upland Analytics now features Quick Filters on Dashboards. These filters (a maximum of three) will always be displayed at the top of the report, allowing viewers to easily apply commonly-used filters.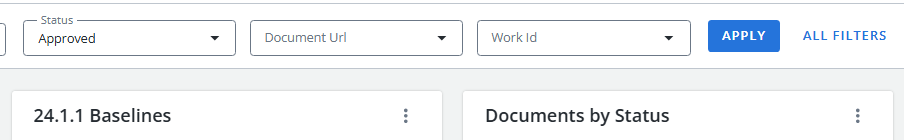
While creating your report, drag and drop any of your selected filters to the "Quick Filters" list to add them as Quick Filters.
Tip: Toggle "Require users to apply filters prior to running report" to ensure that users apply at least one filter to the report before running it.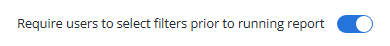
If a user tries to run the report without first applying a filter, an error message will appear with instructions to add one.
This will help prevent timeouts that occur due to unnecessarily large data sets.
Next, users can select the Drilldown Settings tab to create Drilldowns that will link high-level views of data to more granular insights.
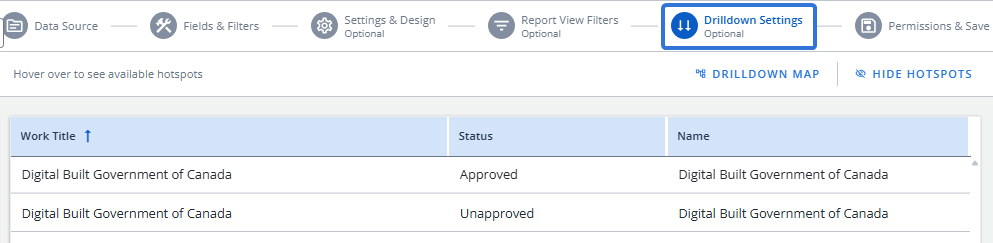
Note: This process differs from Analytics Classic, where users would have to create new Drilldowns using the "Create" menu.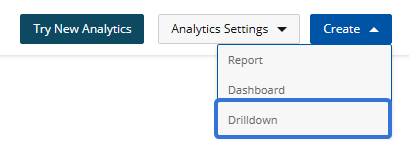
Finally, users can select the Set Permissions & Save tab (or button) to name and save their report, as well as determine who has access to it.
Tip: "NextGen" Upland Analytics allows users to transfer ownership of reports to other users. Select Change Ownership and use the window that appears to select a new owner.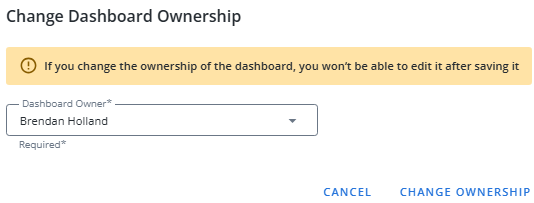
This ensures that valuable reports stay accessible and actionable even when report owners change roles or leave the organization.
Prior to this release, all of the available Dashboard options had to be understood and configured at the beginning of the creation process without much guidance.

With this update, a new streamlined, step-by-step wizard can be used to create Dashboards. Users are guided through the process with helpful prompts, real-time validation, and clear context at every stage.
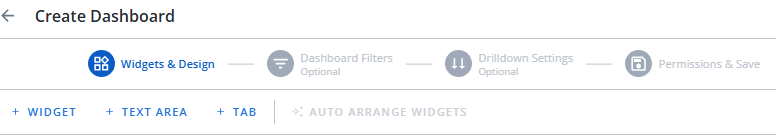
To start, simply select Dashboard from one of the "Create New" drop-down menus.
The fist tab is "Widgets & Design", which allows users to add any Widgets, text boxes, or tabs to the Dashboard.
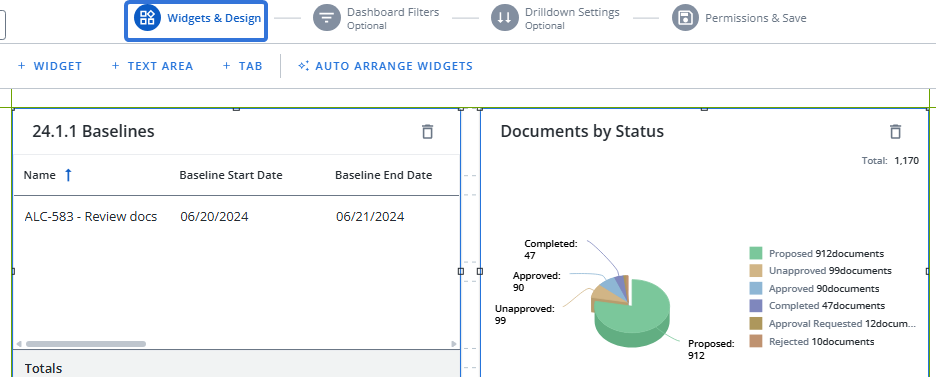
Tip: The Auto Arrange Widgets button is a new alignment feature that automatically arranges widgets with a single click, maximizing space and visual balance. Select it to instantly fit the Widgets to the Dashboard.
Next, users can select the Dashboard Filters tab to apply filters to their new Dashboard.
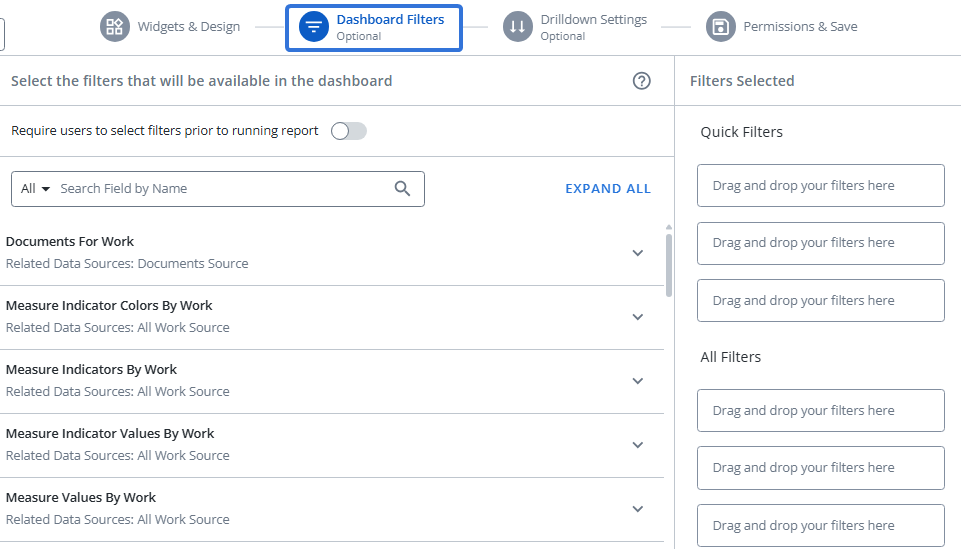
Tip: Upland Analytics now features Quick Filters on Dashboards. These filters (a maximum of three) will always be displayed at the top of the Dashboard, allowing viewers to easily apply commonly-used filters to all Widgets on the Dashboard.
While creating your Dashboard, drag and drop any of your selected filters to the "Quick Filters" list to add them as Quick Filters.
Tip: Toggle "Require users to apply filters prior to running report" to ensure that users apply at least one filter to the Dashboard before running it.
If a user tries to run the Dashboard without first applying a filter, an error message will appear with instructions to add one.
This helps prevent timeouts that occur due to unnecessarily large data sets.
After that, users can select the Drilldown Settings tab to create Drilldowns that will link high-level views of data to more granular insights.
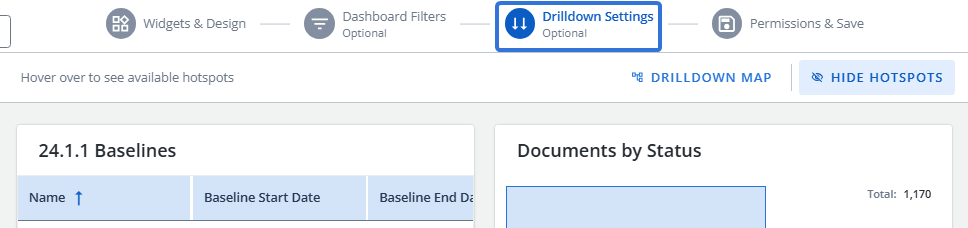
Note: This process differs from Analytics Classic, where users would have to create new Drilldowns using the "Create" menu.
Finally, users can select the Permissions & Save tab (or button) to name and save their Dashboard as well as determine who has access to it.
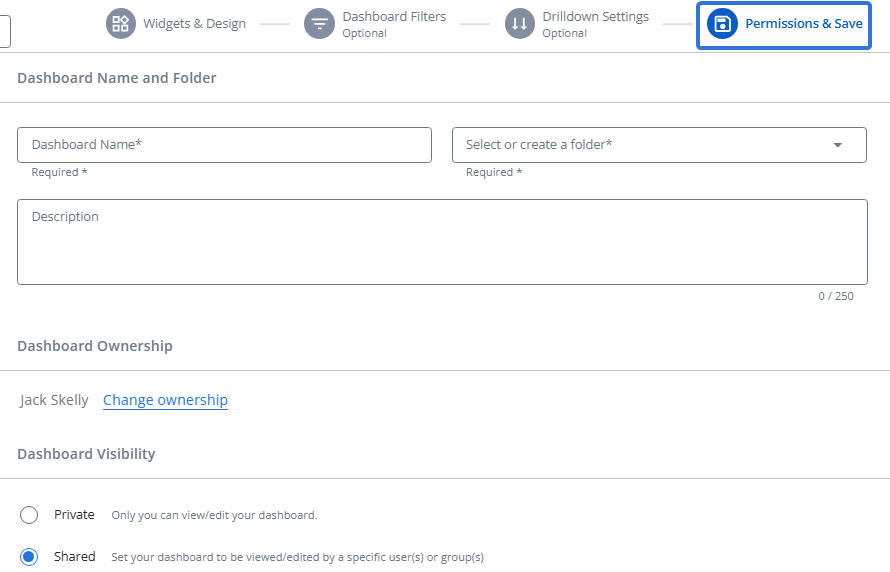
Tip: "NextGen" Upland Analytics allows users to transfer ownership of Dashboards to other users. Select Change Ownership and use the window that appears to select a new Dashboard owner.
This ensures that valuable Dashboards stay accessible and actionable even when report owners change roles or leave the organization.
Note: Upland Analytics Custom Fields are not the same as PowerSteering Custom Fields.
Prior to this release, creating Upland Analytics Custom Fields involved a series of complex drop-down menus as well as a Formula Builder that did not offer much guidance.
The new intuitive Custom Field builder offers an experience that feels familiar to users of light coding tools or Microsoft Excel.
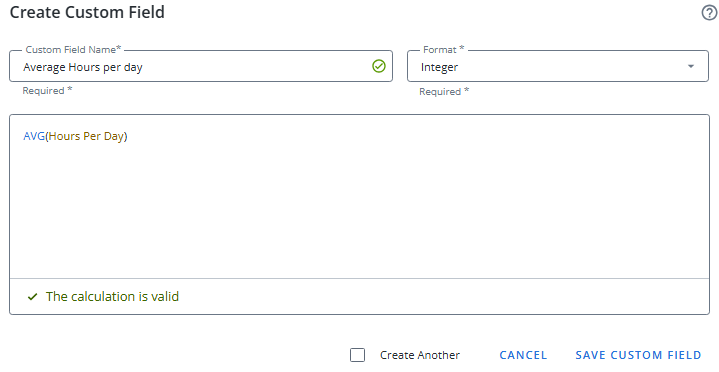
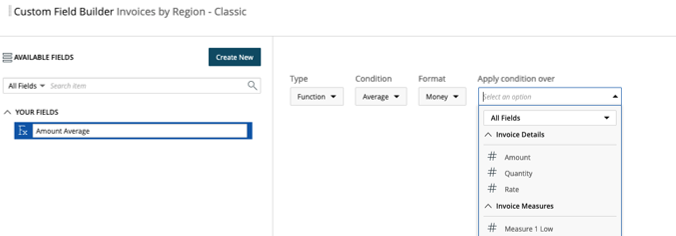
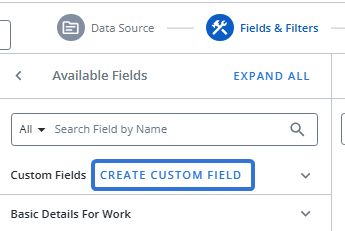
While creating a report, users can select Create Custom Field while on the "Fields & FIlters" tab to open up the new "Create Custom Field" window.
From here, users can name the field and select a format for its values.

Next, they can directly select the large text field to choose a function that will be used to calculate the field's values.
Users can scroll through the list to find other fields that can inserted into the calculation.
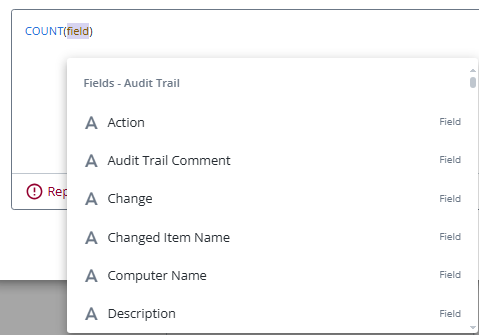
Note: The selected function might prompt users to select one or more fields.
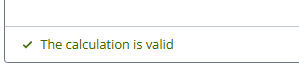
Users are provided with real-time validation and helpful context along the way.
Note: Custom Field functions allow report builders to create intuitive, flexible fields that capture unique data. However, they can be difficult to fully grasp and implement. Reach out to your PowerSteering representative if you need assistance. Also, see Create a Custom Field from the Upland Analytics help site for more information.
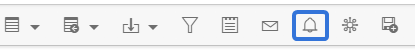
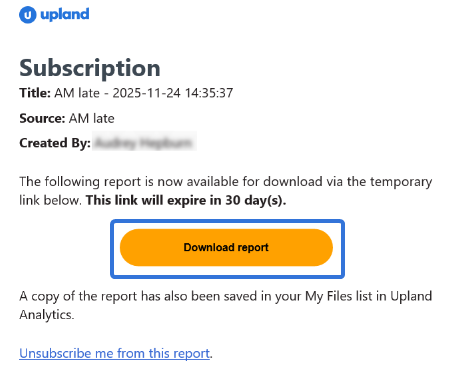
Prior to this release, users would have to navigate to a report or Dashboard and select the Bell icon  to subscribe to it.
With this update, users can create a subscription to a report or Dashboard directly from the Upland Analytics Home page.
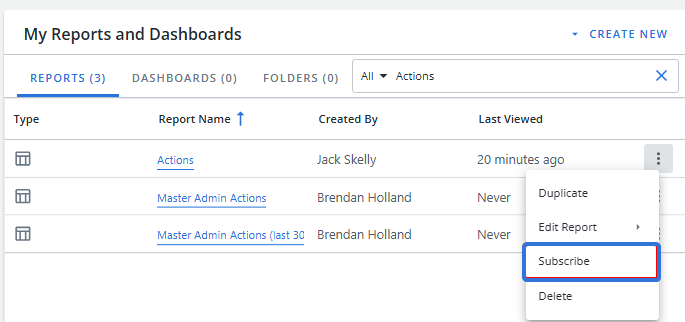
Note: Users can still subscribe to reports and Dashboards by navigating directly to them and selecting See More  → Subscription → Create.
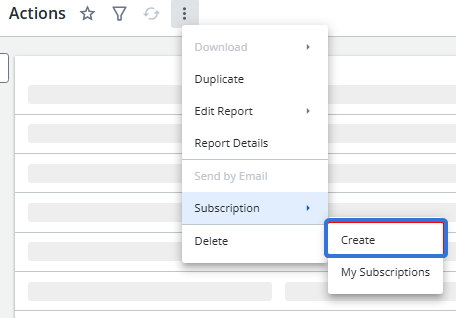
Tip: Emails that are sent to report subscribers have also been updated. See Subscription emails below for more information.
Users can take advantage of the following new subscription features:
Filter options within subscriptions
While creating or editing subscriptions, users can determine how filters will be sent with subscribed reports. The new "Filters Included" drop-down menu has three options:
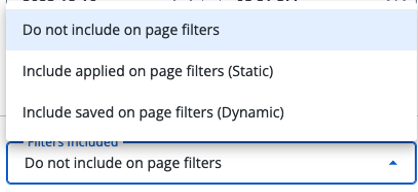
-
Do not include on page filters: The subscription will always be sent with the unfiltered report.
-
Include applied on page filters (Static): The subscription will use the on page filters that are currently applied on the report when you create it. These filters are locked in and will not change, even if you update the on page filters later.
-
Include saved on page filters (Dynamic): The subscription will always use the most up-to-date version of your saved on page filters. If you change your saved on page filters later, the subscription will reflect those changes the next time it runs.
Tip: If there are no saved on page filters, you can select Include saved on page filters (Dynamic) option as a placeholder so that when on page filters are saved in the future, they will be automatically included in the subscription.
Run as "Owner"
Subscription owners can now securely share individual reports and Dashboards with users who do not have default access. By granting temporary "Owner"-level permissions for that specific item, recipients get full visibility without impacting broader access controls.
The recipient list contains a "Run As" column with two options: Owner and Recipient.
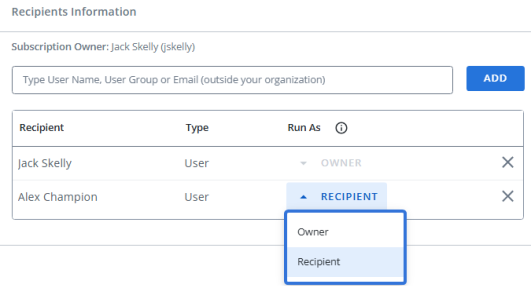
When Recipient is selected, the recipient will retain their own permissions on the report or Dashboard and only view what they are allowed to see. If Owner is selected, the recipient will be able to view the report or Dashboard as if they are the designated Owner, which allows them to view access the report or Dashboard in its entirety.
Note: Emails will NOT be sent out while testing "NextGen" on a staging site. Only the production site will send out subscription emails.
Instead of receiving subscribed reports or Dashboards as email attachments, subscribers will now receive a download link. Selecting Download report/dashboard from a subscription email will automatically download the file onto your device using your browser’s standard download process.
Note: If you or your organization uses automated email-processing tools that monitor report subscription emails and act on report attachments, those processes may need to be updated. Speak to a PowerSteering representative if you require help with this transition.
Note: Download links are temporary. Each subscription email indicates how long the link will last after being sent out: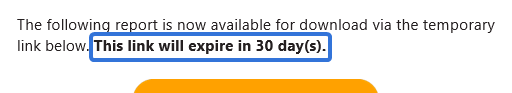
Recipients who select the button after expiration will not be able to download the intended file.
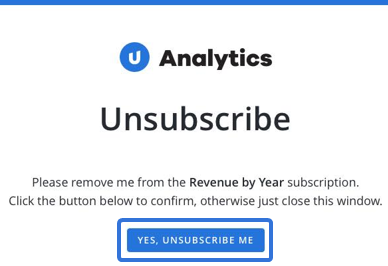
Additionally, users now have the option to unsubscribe to reports and Dashboards directly from subscription emails. Each email now contains an "Unsubscribe" link.
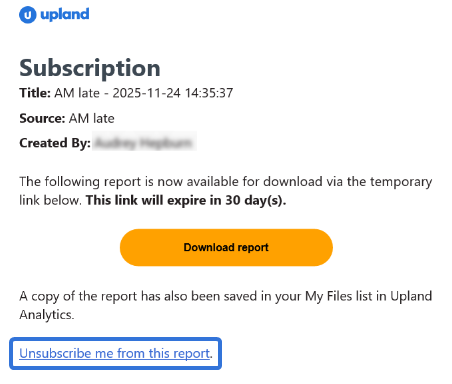
Selecting this link will open up a simple webpage that allows recipients to unsubscribe themselves from the report.
Benefit:
Delivering reports through download links instead of attachments provides a secure and reliable experience that aligns with modern email delivery practices for sharing files. Attached files significantly increase the size of emails, which can sometimes be delayed or blocked due to mailbox size limits or attachment restrictions. PowerSteering download links keep subscription emails lightweight because the report itself is not transmitted through the email system, helping ensure that you can access your subscribed reports more directly and with fewer interruptions.
Prior to this release, users accessed report features by opening the menu and selecting from a wide range of options.
With this update, the interface has been redesigned for improved usability and efficiency. Key actions are now surfaced more intuitively within the report view itself, reducing reliance on a centralized menu and streamlining user interaction.
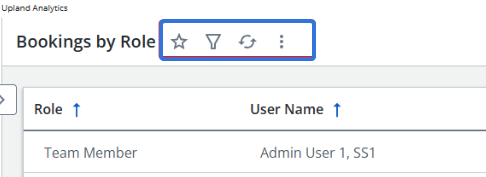
The menu options are as follows:
-
Favorite
 : Select the icon to add the report as a Favorite. Users can easily navigate to their Favorites at any time by expanding the "Favorites" tab on the Analytics Menu.
Note: Reports that display a blue version of the icon
 have already been saved as Favorites. Selecting a blue icon will un-Favorite the report.
 -
Filters
 : Select the icon to open up the "Filters" drawer on the right-hand side of the report. From here, you can view and apply any of the On-Page Filters that have been included with the report.
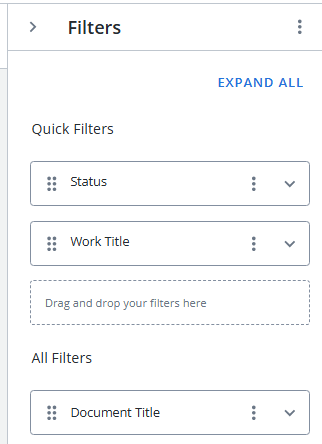
Note: Filters can be added to reports and Dashboards during creation or while editing.
Note: Reports that display a blue version of the icon
 already have filters applied to them.
 -
Refresh
 : Select the icon to refresh the report data. Users can also hover over the icon to view the last time that the data was refreshed.
 -
See More
: Take additional actions on the report.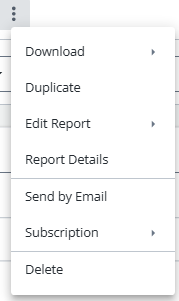
-
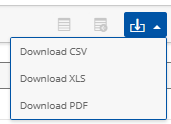
Download: Download the report onto your device as a PDF, XLS, or CSV file. See below for more information.
-
Duplicate: Create a new report with identical characteristics automatically loaded into the creation wizard.
-
Edit Report: Edit any of the reports settings.
-
Report Details: Select to open the "Report Details" drawer, which displays the report's description, owner, creation date, last modified date, and folder location.
-
Send by Email: Send out the report via email. This opens the "Send by Email" drawer, which allows users to enter email recipients, add a subject line / message, and choose which file format the report should be sent as.
-
Subscription: Select this to create a new subscription to the report or to manage your own subscriptions.
-
Delete: Delete the report from Upland Analytics.
-
Prior to this release, users could download a report by selecting a file format from its "Download" menu.
A window would appear in the bottom right-hand corner of the screen indicating that the report was being processed.
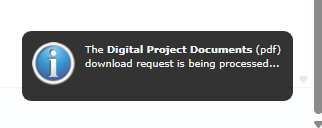
With this update, Upland Analytics has introduced the Download Manager, which is exclusive to "NextGen" Upland Analytics interface. Whenever a user downloads a report, chart, graph, or Dashboard, the file is sent to the Download Manager. The Download Manager displays all downloaded files from your current session, both pending and ready for download.
Note: You can open up the Download Manager at any time from the Analytics Menu on the left-hand side of the screen.
Users will receive two notifications after navigating to a report or Dashboard and selecting See More → Download.
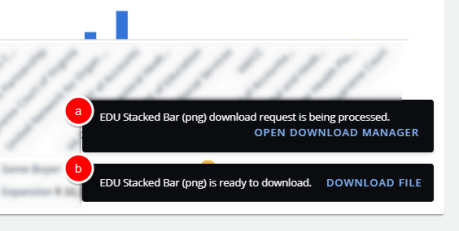
-
The request is pending. Selecting Open Download Manager allows users to view all of their downloads from the current session.
-
The file is ready for download. Selecting Download File allows users to download the file onto their computer.
If a file takes a long time to render, the Download Manager automatically opens and displays the name of the report, graph, chart, or Dashboard and the status of the download.
![]()
Once it completes, a "Ready to Download" notification will still appear. Users have the option to download files by selecting Download File from the notification or selecting the Download button  next to any of the listed files in the Download Manager.
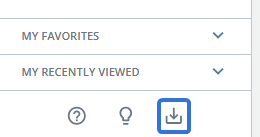
Additionally, users can always access the Download Manager by selecting the Download Manager icon from the bottom of the Analytics Menu.
Prior to this release, new folders could be created directly from the Analytics Menu.
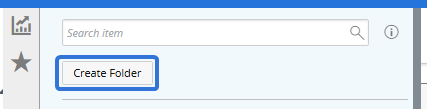
With this update, they can now be created directly from the "My Reports and Dashboards" window on the "My Analytics" page. Users must select the "Folders" tab and then select the New Folder icon  .
.
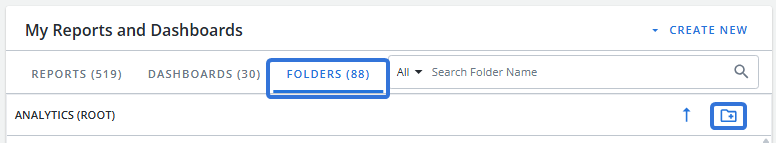
This opens up the "Create New Folder" window.
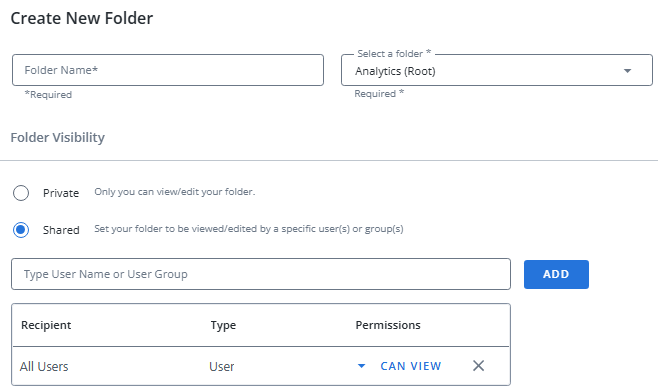
See Create a Folder for more information.
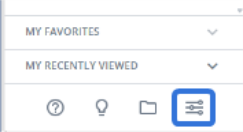
Prior to this release, the general settings for Upland Analytics could be edited by opening the "Analytics Settings" menu.
With this update, they can be accessed by selecting the Settings icon  at the bottom of the Analytics Menu.
From here, the following settings can be configured:
-
Data Configuration: Configure the database connection used by Upland Analytics to access reporting data. See Database Connections for more information.
-
My Stuff: Use My Files to navigate and manage your own files or use My Profile to manage your user information.
-
Preferences: Use Color Palettes to configure your own custom colors that can be applied to graphs and charts. Use SFTP Settings to configure a Secure File Transfer Protocol (SFTP) connection for secure file transfers.
-
Subscriptions: Configure your Upland Analytics Subscriptions.
-
User Management: Use Access Control to determine the permissions given to user roles in Upland Analytics. Use User Groups to create and manage groups of users in Upland Analytics.
"NextGen" Walkthrough Video
To help users prepare for Upland Analytics 2026R1.6, PowerSteering Product Manager Robert Straume recorded the following "Ask The Experts" video in March 2026, highlighting the key changes and enhancements introduced in this release:
Use the timestamps below to jump directly to specific sections of the video:
0:14 - Introduction
1:38 - Analytics Classic
7:36 - Home Page ("My Analytics")
9:20 - Viewing and Creating Folders
11:19 - Analytics Menu
12:31 - Subscription Emails
13:47 - Analytics Settings
17:18 - Create a Report
29:30 - Report Actions
35:28 - Creating Drilldowns
44:14 - Creating Custom Fields
50:04 - Settings and Design (Table)
54:00 - Create a Dashboard
57:45 - How to Prepare for "NextGen" Analytics
Note: Contact your PowerSteering representative if you are interested in joining any future "Ask The Experts" seminars.
Housekeeping and Transition Considerations
Review the following information and tips to help prepare for "NextGen" Analytics:
Custom layouts created in earlier versions are not carried forward to "NextGen" Upland Analytics.
What's Changing:
Any saved custom layouts from earlier versions will be lost when transitioning to "NextGen" Upland Analytics.
What Still Works:
You can still adjust column order, sort order, and column width in tabular reports. However, these changes apply only to the current view and are not saved for reuse.
Potential Impact:
This may affect integrations that rely on specific column order. If you export tabular reports to another system, the column order may change when custom layouts are removed, causing issues with imports downstream.
Actions Required:
Contact PowerSteering Support to request a script identifying reports that used custom layouts.
If column order is critical for integrations, manually update the affected reports to match the required structure before using them in "NextGen" Upland Analytics.
Subscriptions that include inactive users create unnecessary entries in the Subscription Manager and may cause longer lists to review and manage.
What Happens:
-
Emails are NOT sent to inactive users (the system automatically skips them as in previous releases).
-
Active users will still receive their reports normally.
-
Inactive users simply appear in your Subscription list, potentially making it longer to review.
Impact:
This is purely a housekeeping opportunity with no functional impact. Removing inactive users improves visibility and streamlines subscription management.
Action Recommended (Optional):
Contact PowerSteering Support to request a list of subscriptions with inactive users and consider removing inactive users from subscriptions for cleaner list management.
Old or unused reports may remain in your reporting environment and make it harder to manage active content.
Note: An unused report is defined as a report that has not been run manually by a user, included in a Dashboard, or delivered through a Subscription. Reports are typically considered unused if they have not been run for a year or more, although this threshold can be adjusted to meet your specific needs.
Impact:
Unused reports consume storage and may appear in search results, creating confusion. Cleaning up unused reports makes it easier for users to find the reports they need and improves the overall performance of Upland Analytics.
Action Recommended (Optional):
Contact PowerSteering Support to request a list of unused reports and retire any reports that are no longer required.