New Analytics
The new "NextGen" Upland Analytics interface is designed to make exploring your data faster, clearer, and more intuitive. Whether you're tracking progress, spotting trends, or uncovering gaps, this modernized experience puts the reports, charts, and dashboards you rely on right at your fingertips—organized the way you want them. Get ready to turn insights into action, with less clicking and more clarity.
To help you get up to speed with the new version of "NextGen" Upland Analytics, we have created a series of short videos that highlight key improvements. Each video focuses on a specific area of Upland Analytics, making it easy to explore what’s new at your own pace. Below, you will find the Videos Showcasing Key Improvements alongside some Best Practices Before Upgrading and a Summary of the Most Important Changes in this release:
Videos Showcasing Key Improvements
Best Practices Before Upgrading
Upgrading to NextGen Analytics is the perfect time to do a little housekeeping. Take the opportunity to review and remove test reports or those no longer in active use.
Tip: If you need help identifying unused reports, contact PSA Support for assistance in generating a list tailored to your environment.
Why It Matters:
- Unused reports can clutter your reporting environment, consume unnecessary storage, and appear in search results—making it harder for users to find what they need.
- Cleaning up old reports improves system performance and ensures that only relevant, trusted content remains available.
Summary of the Most Important Changes
After navigating to Upland Analytics in PSA, select the Try New Analytics button in the top right-hand corner of the screen.

This will open up "NextGen" Upland Analytics, where you can find all of your existing Upland Analytics data in a new format.

A lot of things are different in this new version of Upland Analytics. Select any of the processes below to see how they have changed:

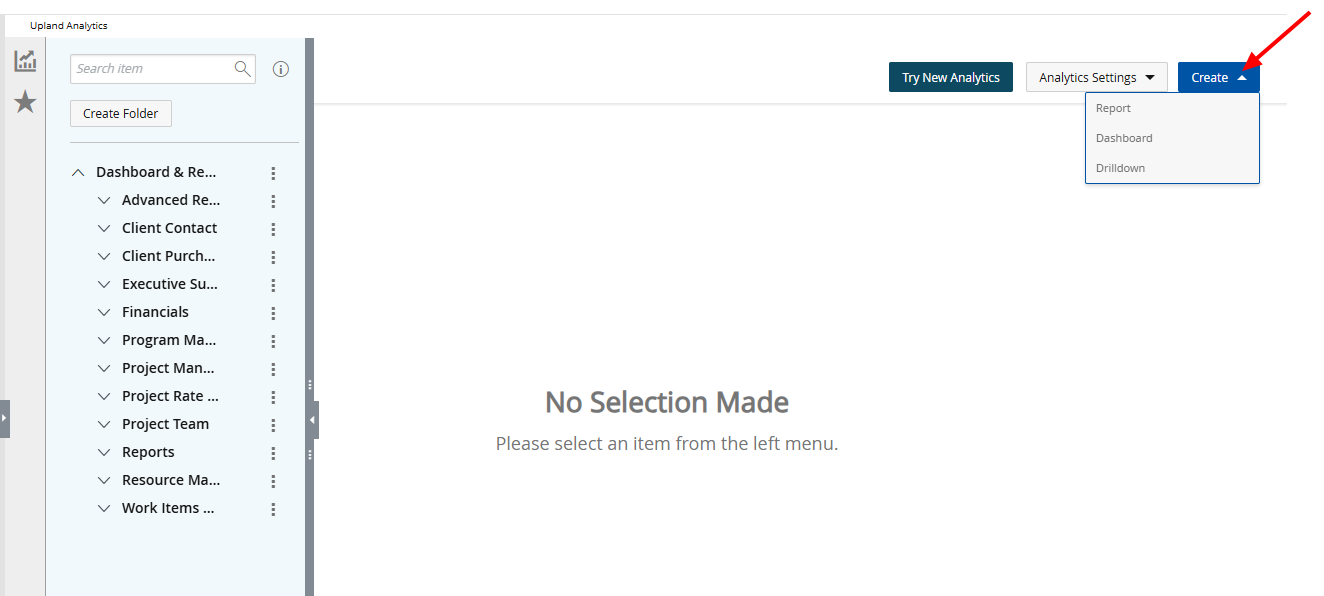
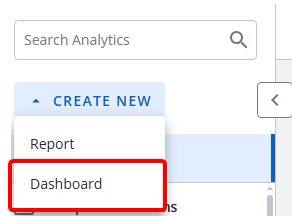
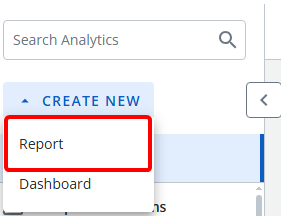
Before this release, the Create New dropdown list was located on the Main Menu bar.

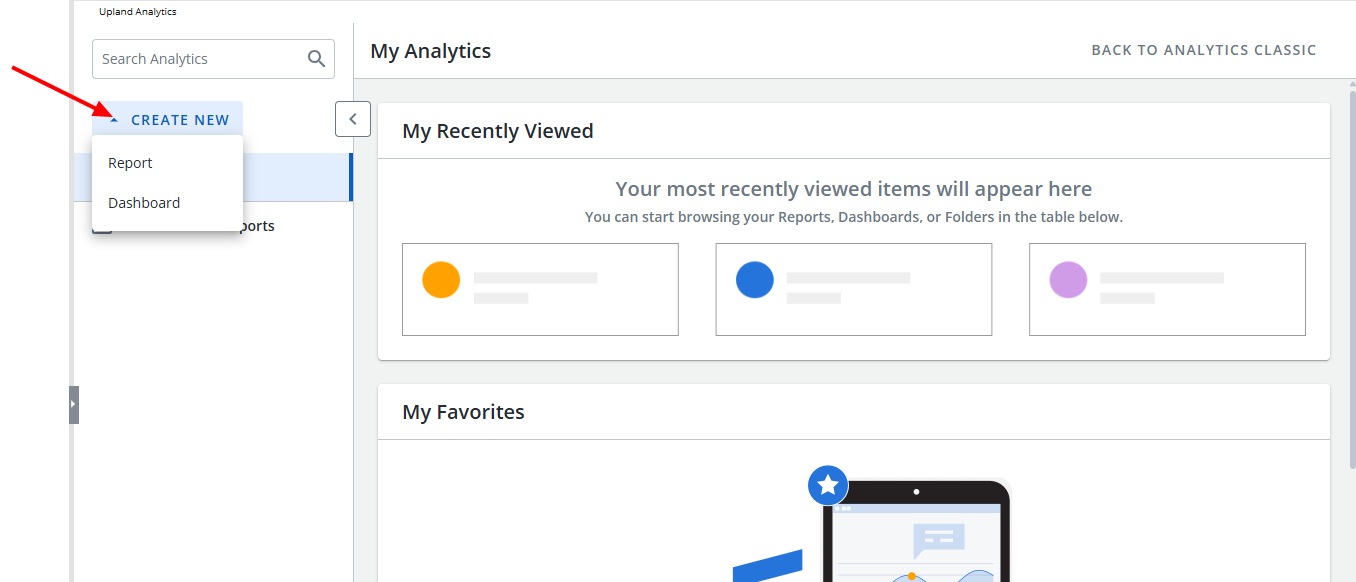
The Create New dropdown list now appears on the left side of the page, just below the Search bar.
For further details refer to:
Prior to this release, PSA users needed to understand and configure all of the available Dashboard options at once without much guidance.
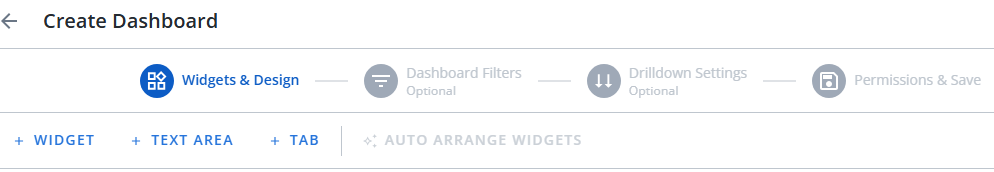
With this update, a new streamlined, step-by-step wizard can be used to create Dashboards. Users are guided through the process with helpful prompts, real-time validation, and clear context at every stage.
To start, simply select Dashboard from the "Create New" drop-down menu.
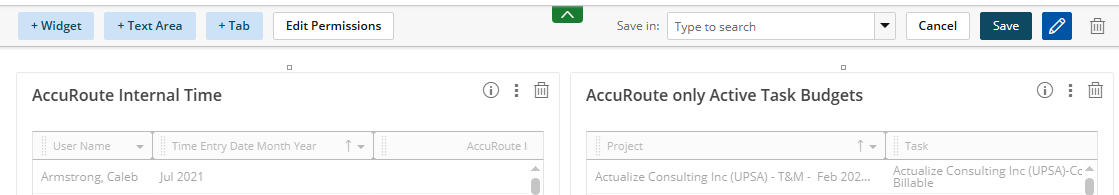
The "Widgets & Design" tab closely reflects the classic interface, allowing users to add any Widgets, text boxes, or tabs to the Dashboard.
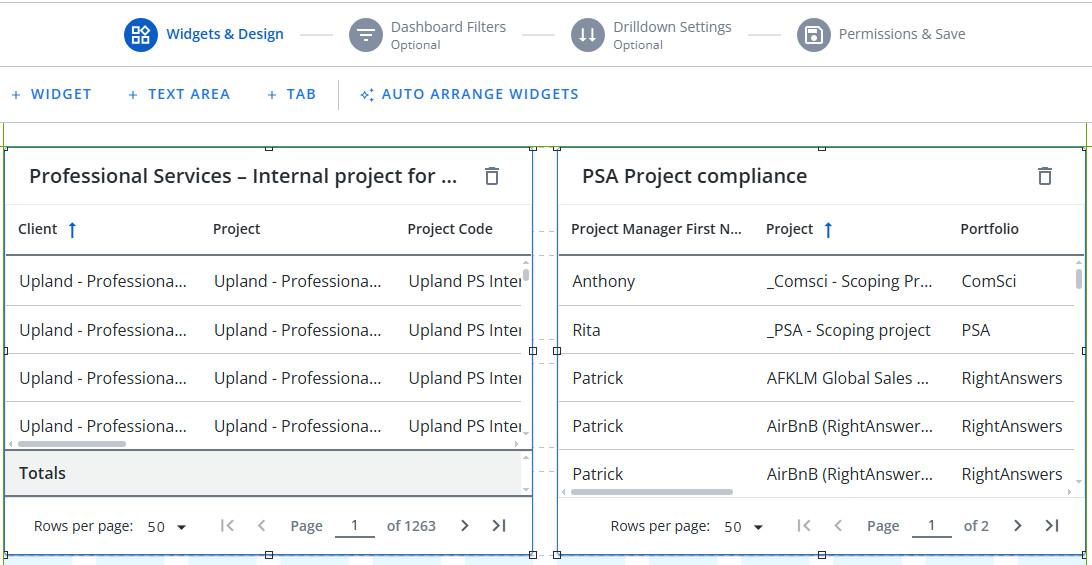
Tip: The Auto Arrange Widgets button is a new alignment feature that automatically arranges widgets with a single click, maximizing space and visual balance. Select it to fit the Widgets to the Dashboard in the most intuitive way.
Next, users can select Dashboard Filters to apply filters to their new Dashboard.
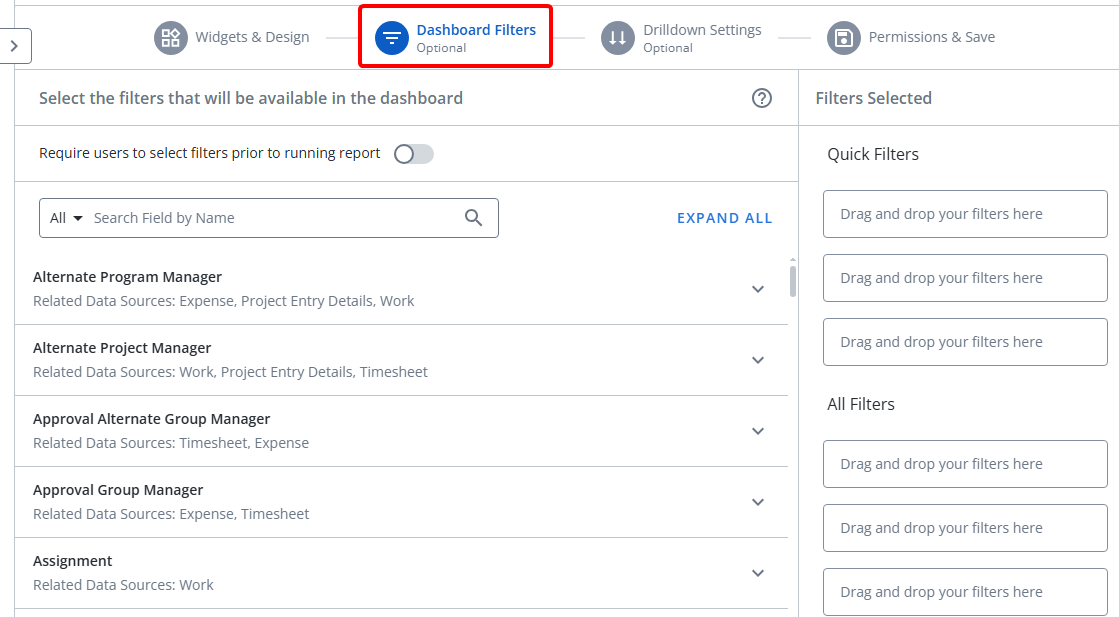
Tip: Upland Analytics now features "Quick Filters" on Dashboards. These filters (a maximum of three) will always be displayed at the top of the report, allowing viewers to easily apply filters that may be commonly used.
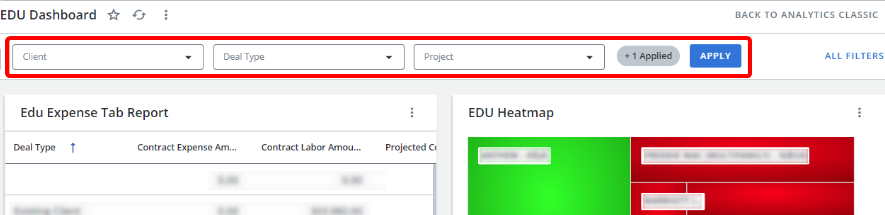
While creating your Dashboard, drag and drop any of your selected filters from the "All Filters" list to the "Quick Filters" list to add them as Quick Filters.
Tip: Toggling "Require users to apply filters before running report" will ensure that users apply at least one filter to the Dashboard before running it.
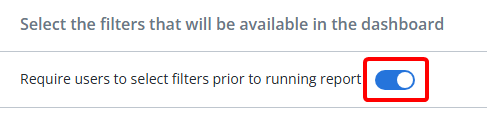
If a user tries to run the Dashboard without first applying a filter, an error message will appear with instructions to add one.
 This will help ensure that Dashboards do not cause any timeouts due to unnecessarily large data sets.
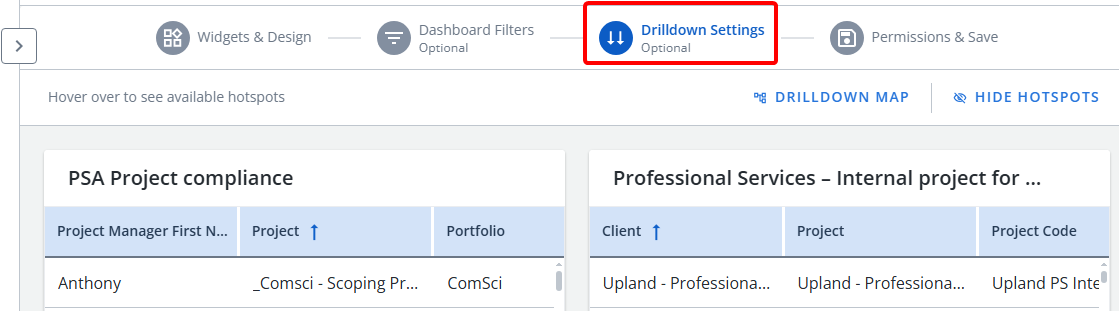
After that, users can select Drilldown Settings to create Drilldowns that will link high-level views of data to more granular insights.
Finally, users can select Permissions & Save to name and save their Dashboard, as well as determine who has access to it.
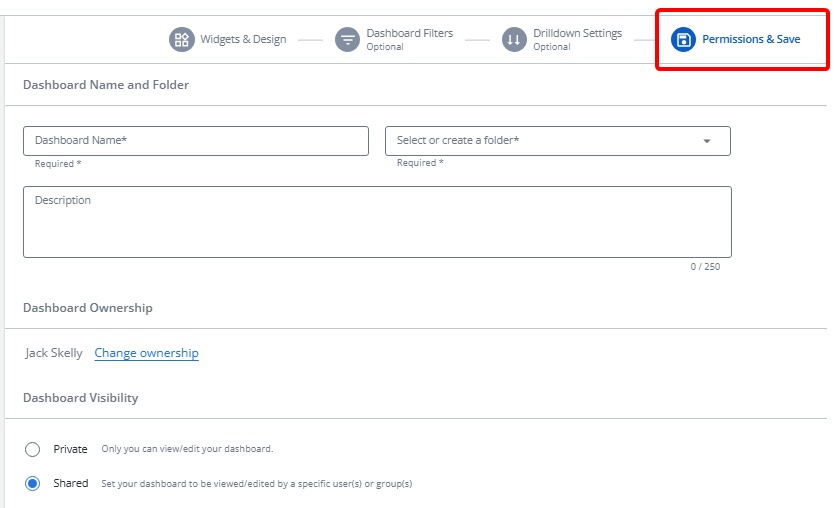
Tip: "NextGen" Upland Analytics allows users to transfer ownership of Dashboards to other users. Select Change Ownership and use the window that appears to select a new Dashboard owner.
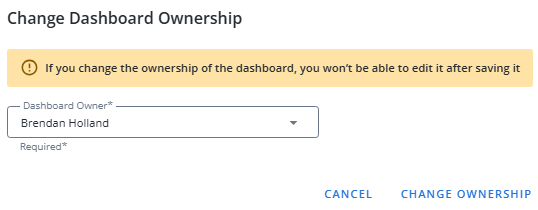
This ensures that valuable Dashboards stay accessible and actionable even when report owners change roles or leave the organization.
Prior to this release, Upland Analytics users had to build their reports first and then go back afterward to apply additional settings.
With this update, the report-building experience is now intuitive and uninterrupted, allowing users to fine-tune settings like filters and formatting as they build, all within a single streamlined workflow.

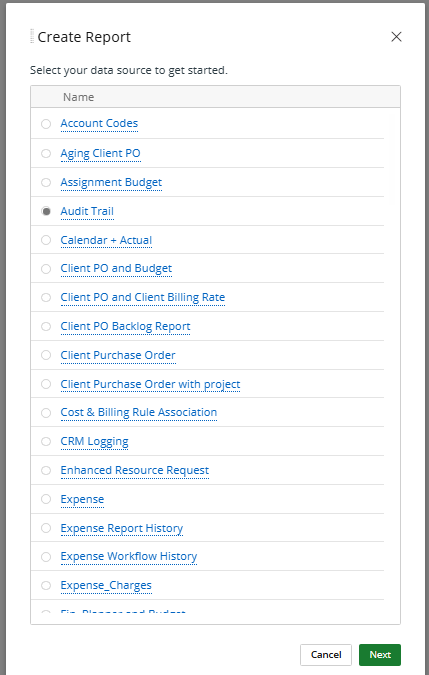
To start, simply select Report from the "Create New" drop-down menu.
The "Data Source" tab allows users to select a Data Source to simplify the data selection process.
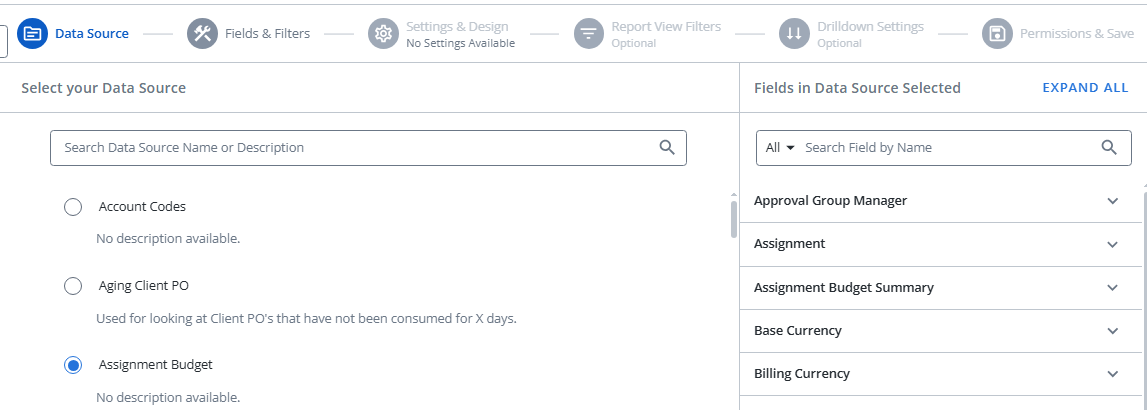
Tip: The Data Views and fields available for the selected Data Source will be previewed on the right-hand side of the page. This allows report builders to validate that they have selected the correct Data Source before moving on to the next step.
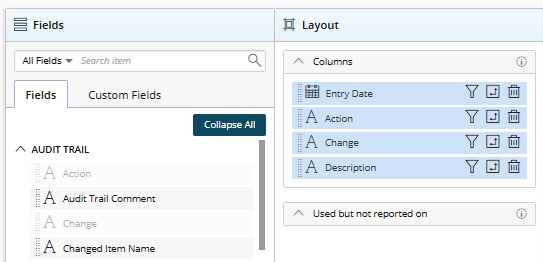
Users can select Fields & Filters or the Next button to determine the fields that will be displayed on their report, as well as the report type. Just like in the classic version, filters can be added to each selected field.
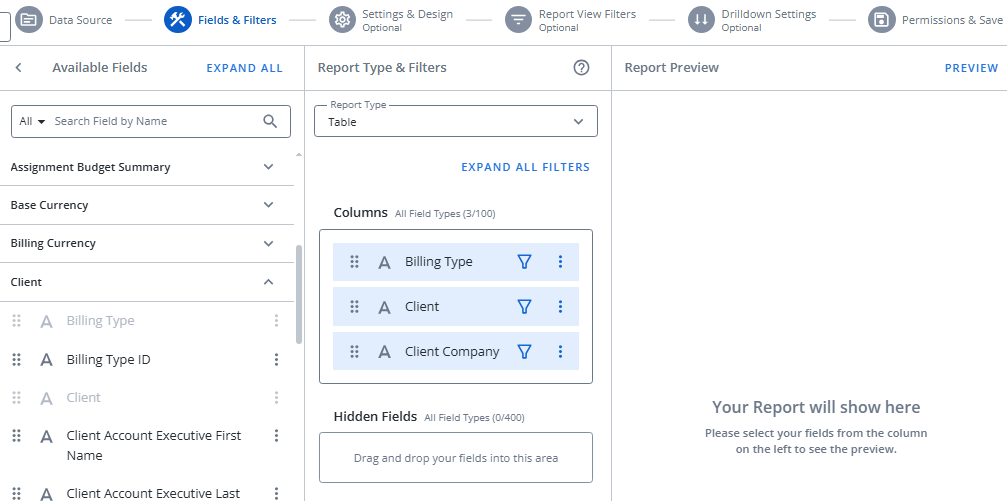
Tip: Select the Preview button in the top right-hand corner of the page to see what your report currently looks like.
Note: From here, report builders can create Custom Fields for their report.
Note: Unlike the classic version, changing the report type in Upland Analytics will not erase all of your selected fields.
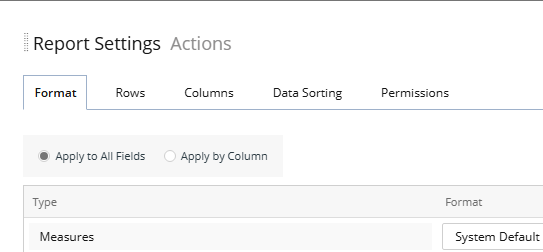
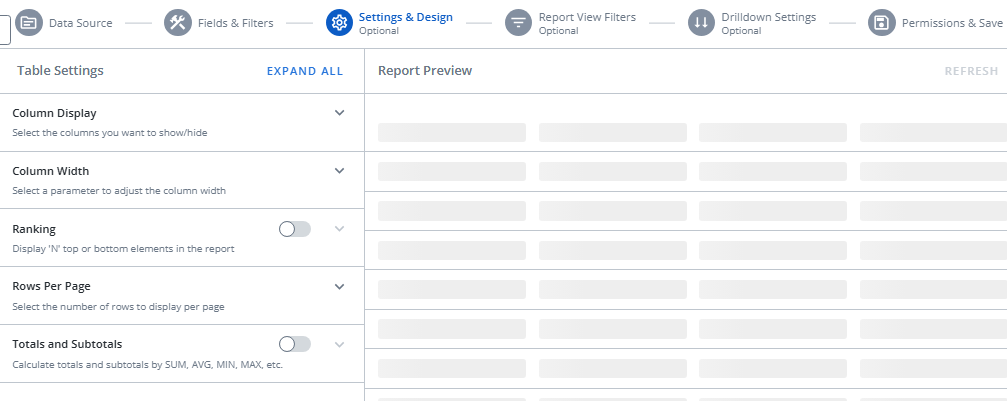
Next, users can select the Set Permissions & Save button to skip to the last step, or they can select Settings & Design to configure settings unique to the selected report type.
Next, users can select the Set Permissions & Save button to skip to the last step, or they can select Report View Filters to create any on-page filters that report viewers will be able to apply themselves when they interact with your report.
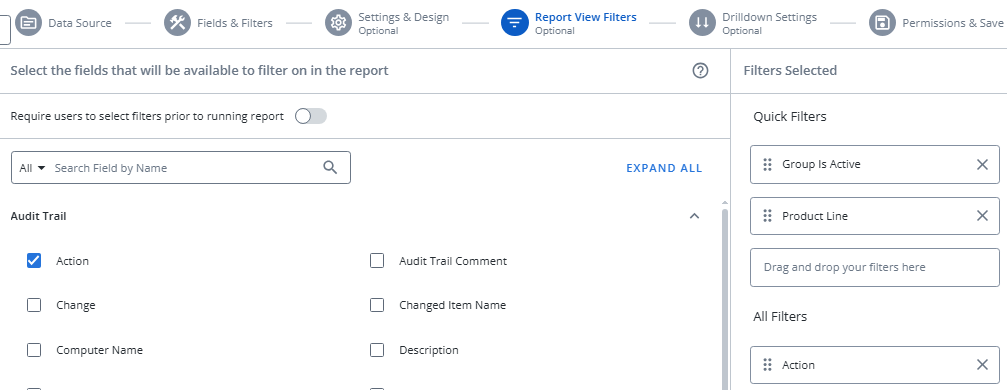
Tip: Upland Analytics now features "Quick Filters" on reports. These filters (a maximum of three) will always be displayed at the top of the report, allowing viewers to easily apply filters that may be commonly used.
While creating your report, drag and drop any of your selected filters from the "All Filters" list to the "Quick Filters" list to add them as Quick Filters.
Tip: Toggling "Require users to apply filters before running report" will ensure that users apply at least one filter to the report before running it.
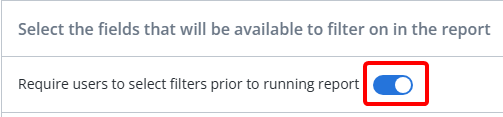
If a user tries to run the report without first applying a filter, an error message will appear with instructions to add one.
This will help ensure that reports do not cause any timeouts due to unnecessarily large data sets.
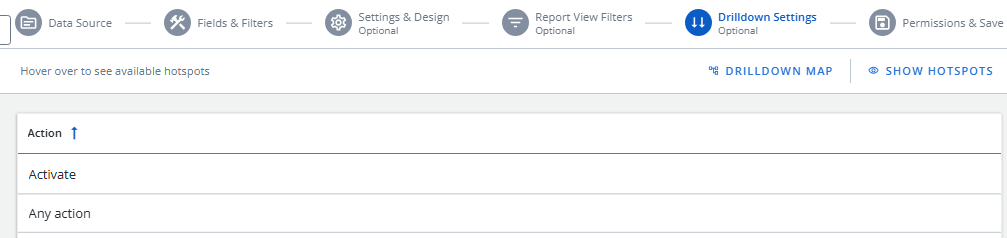
Next, users can select the Set Permissions & Save button to skip to the last step, or they can select Drilldown Settings to create Drilldowns that will link high-level views of data to more granular insights.
Finally, users can select the Set Permissions & Save button to name and save their report, as well as determine who has access to it.
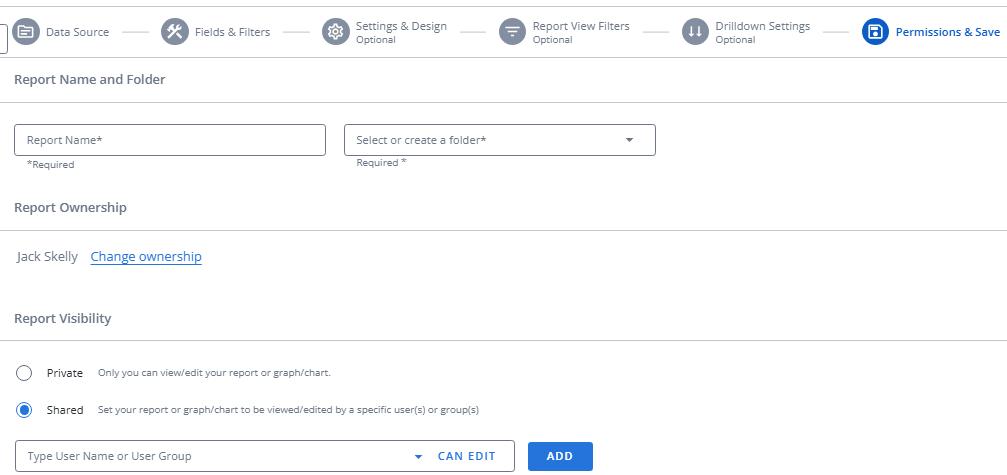
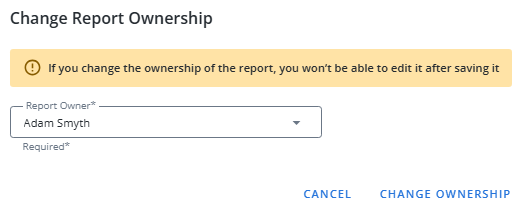
"NextGen" Upland Analytics allows users to transfer ownership of reports to other users. Select Change Ownership and use the window that appears to select a new report owner.
This ensures that valuable reports stay accessible and actionable even when report owners change roles or leave the organization.
Prior to this release, creating Custom Fields in Upland Analytics involved a series of complex drop-down menus.
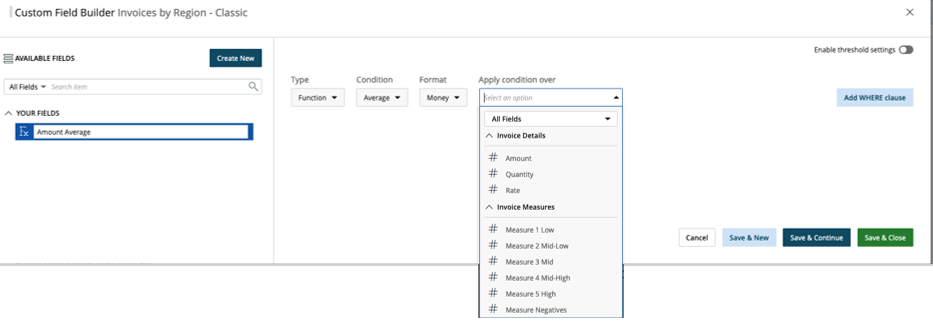
The new, more intuitive Custom Field builder offers an experience that feels familiar to users of light coding tools or Microsoft Excel.
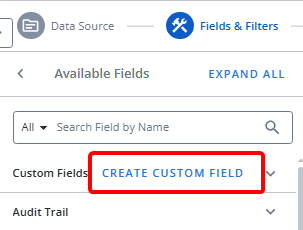
While creating a report, users can select the Create Custom Field button while on the "Fields & FIlters" tab.
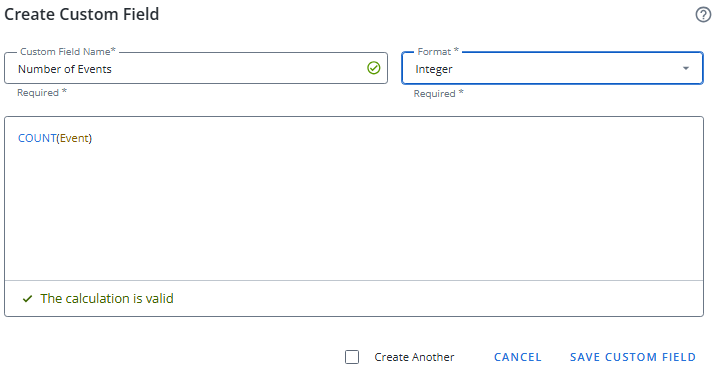
This will open up the "Create Custom Field" window. Users can directly select the large text field to select a function that will be used to calculate the Custom Fields values.
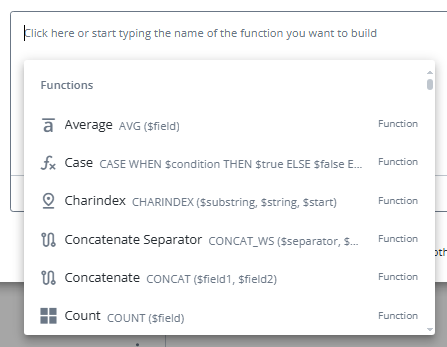
Users can scroll through the list to find other fields that can inserted into the calculation. Alternatively, the selected function might prompt users to select one or more fields.
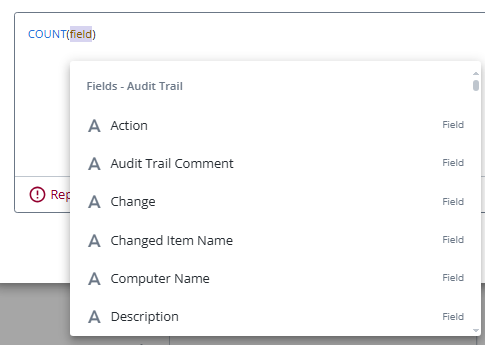
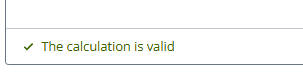
Users are provided with real-time validation and helpful context along the way.
Note: Custom Field functions allow report builders to create intuitive, flexible fields that capture unique data. However, they can be difficult to fully grasp and implement. Reach out to your PSA representative if you need assistance and see Create a Custom Field from the Upland Analytics help site for more information.
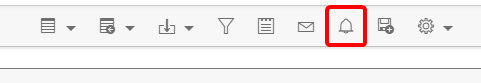
Prior to this release, users would have to navigate to a report or Dashboard and select the Bell icon  to subscribe to it.
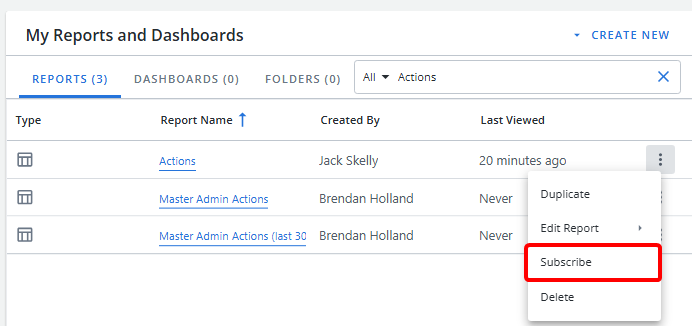
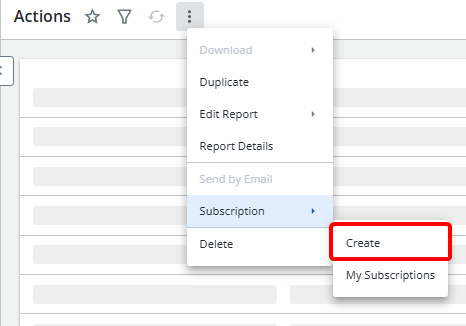
With this update, users can create a subscription to a report or Dashboard directly from the Upland Analytics Home page.
Note: Users can still subscribe to reports and Dashboards by navigating to them.
Additionally, users can take advantage of multiple new features that pertain to subscriptions.
Filter options within subscriptions
While creating or editing subscriptions, user can determine how filters will be sent with subscribed reports. The new "Filters Included" drop-down menu has three options:
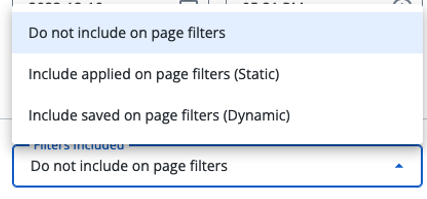
- Do not include on page filters: The subscription will always be sent with the unfiltered report.
- Include applied on page filters (Static): The subscription will use the on page filters that are currently applied on the report when you create it. These filters are locked in and won’t change, even if you update the on page filters later.
- Include saved on page filters (Dynamic): The subscription will always use the most up-to-date version of your saved on page filters. If you change your saved on page filters later, the subscription will reflect those changes the next time it runs.
Tip: If there are no saved on page filters, you can select Include saved on page filters (Dynamic) option as a placeholder so that when on page filters are saved in the future, they will be automatically included in the subscription.
Run as "Owner"
Subscription owners can now securely share individual reports and dashboards with users who don’t have default access. By granting temporary "Owner"-level permissions for that specific item, recipients get full visibility without impacting broader access controls.
The recipient list now contains a "Run As" column with two options: Owner and Recipient.
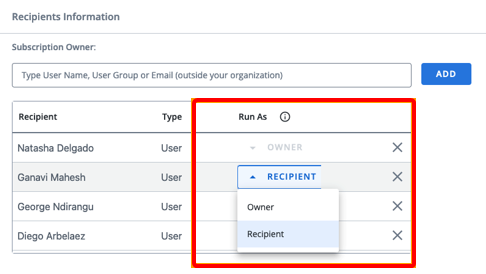
When Recipient is selected, the recipient will retain their own permissions on the report or Dashboard and only view what they are allowed to see. If Owner is selected, the recipient will be able to view the report or Dashboard as if they are the designated Owner, which allows them to view access the report or Dashboard in its entirety.
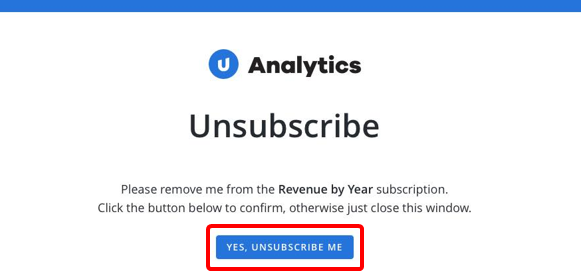
Unsubscribe link in subscription emails
Users now have the option to unsubscribe to reports and Dashboards directly from the subscription emails. Each email now contains an "Unsubscribe" link.
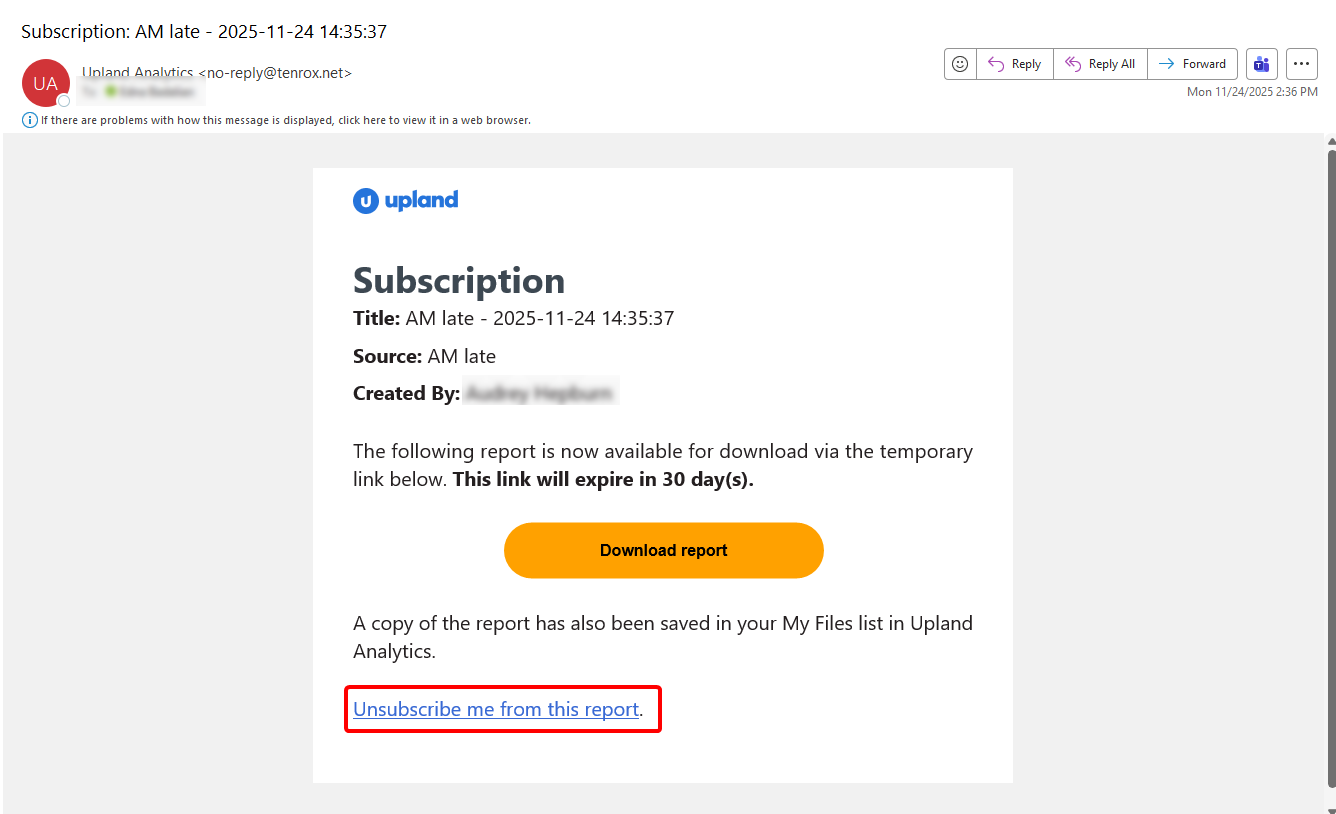
Selecting this link will open up a simple webpage that allows the user to unsubscribe.
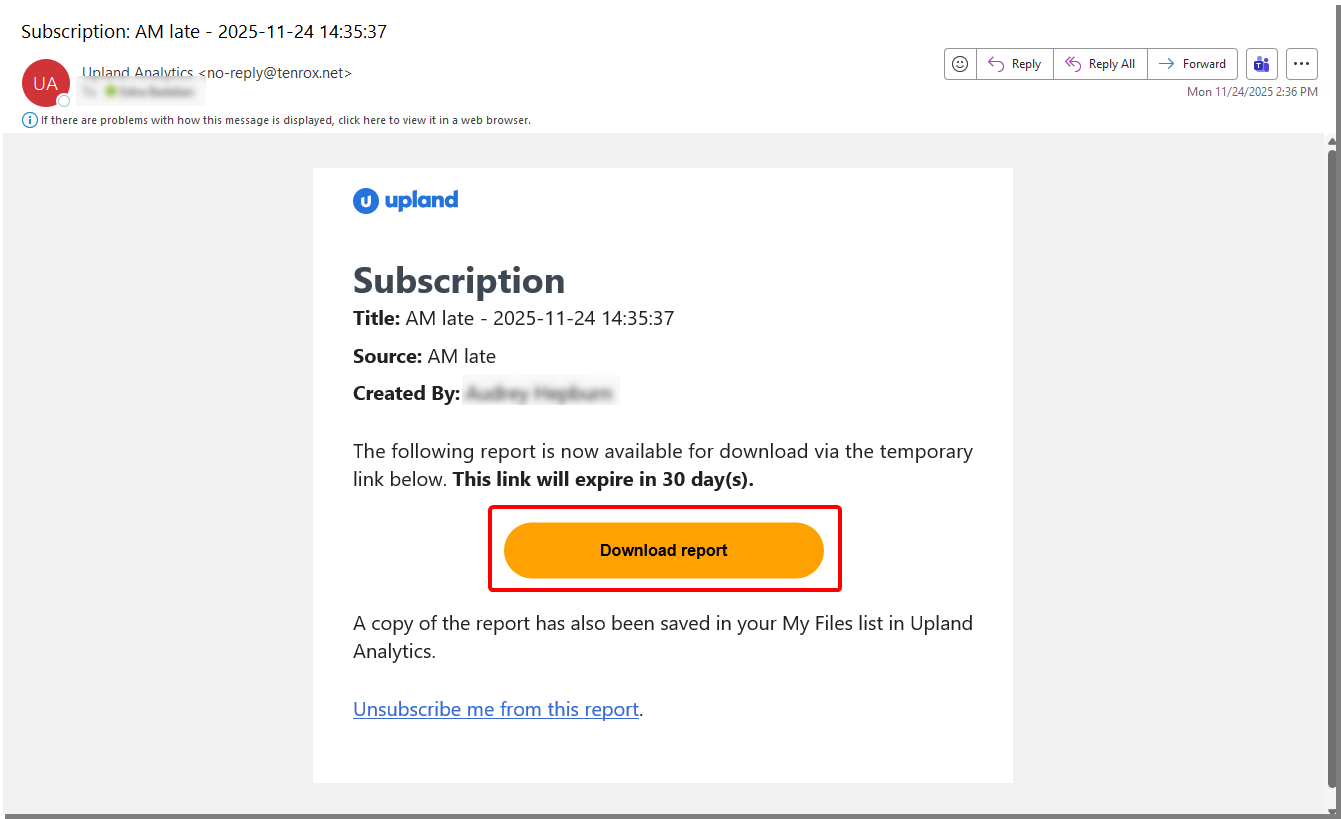
Download Reports/Dashboards from subscription emails
Instead of receiving reports or dashboards as email attachments, you will now receive a download link. Select Download Reports/Dashboards to begin the download. The files download using your browser’s standard download process.
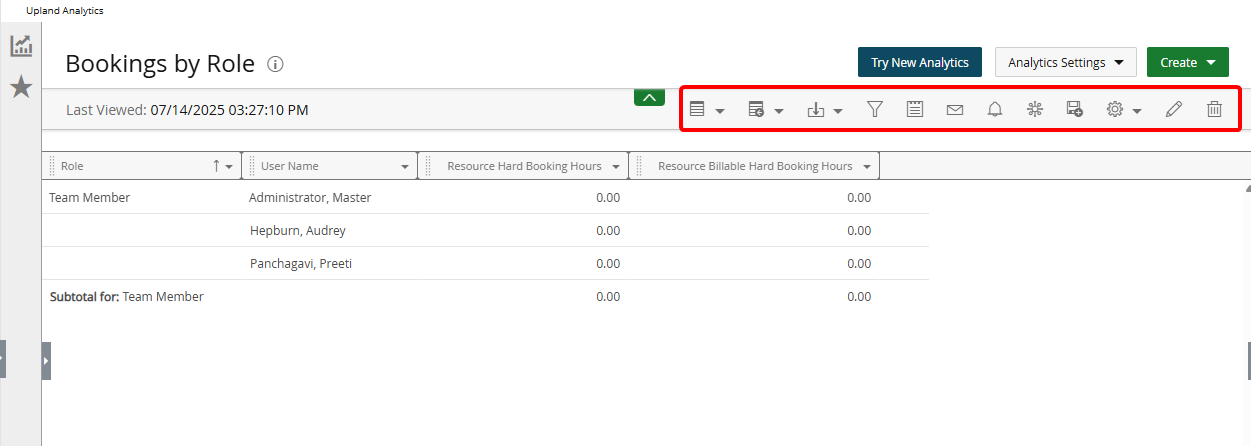
Prior to this release, accessing report features required clicking the Open Menu, which presented a range of options including: Save Layout, Reset Layout, Download, Filter, Notes, Email, Subscribe, New Subscription, Configure Drill-in, Save as and Edit Settings which included Settings and My Settings.
As of this release, the interface has been redesigned for improved usability and efficiency. Key actions are now surfaced more intuitively within the report view itself, reducing reliance on a centralized menu and streamlining user interaction. Below is a breakdown of the updated options and their locations.
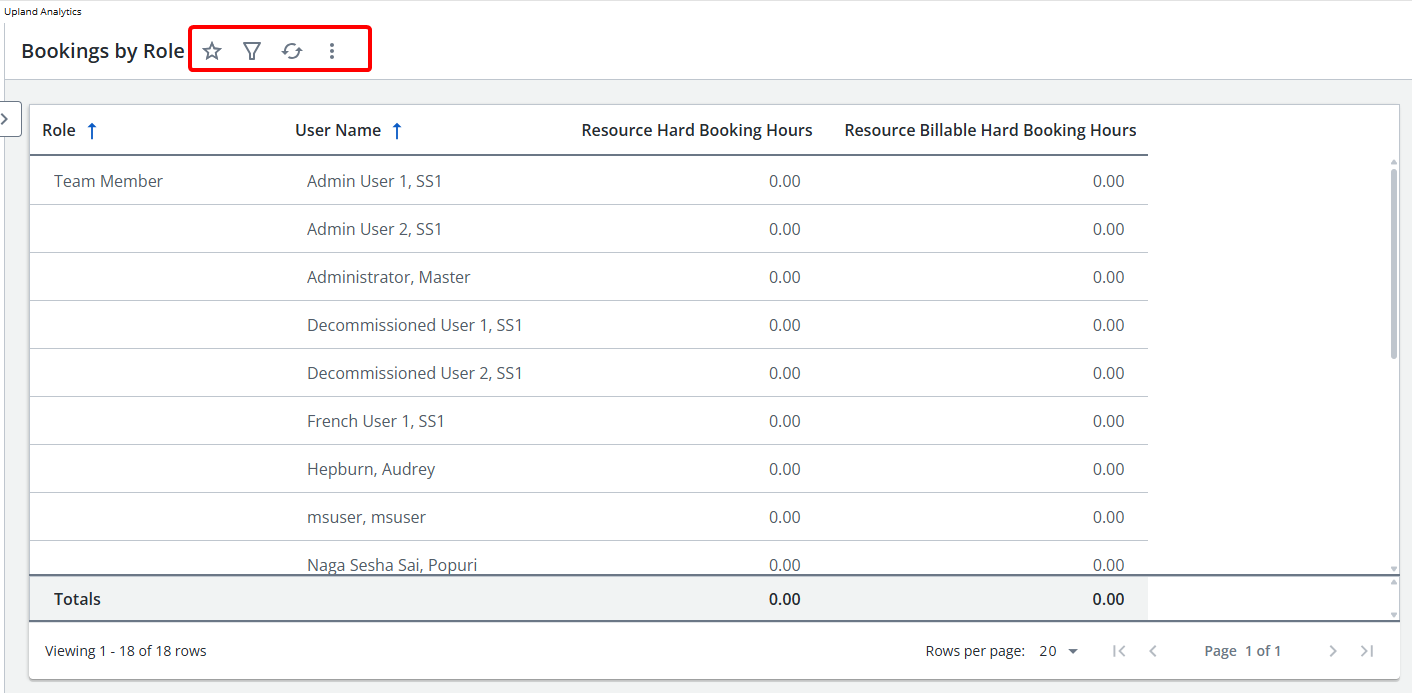
Favorite : Click this button to add the report as a favorite.  indicates that the report has already been added as a favorite. Click to remove the report from the My Favorites list.
Filter  : Click this button to open the filter drawer and apply a filter to the report , if they are available.
  indicates that a filter is applied to the report. For more information, see On Page Filters.
Note: When quick filters are applied, they display in the quick filter area on top of the report and in the Quick Filters section in the filter drawer. For more information, see Working with Quick Filters.
Refresh  : Click this button to refresh the data or hover over this button to view the last time that the data was refreshed.
See more  : Click this button and then choose one of the following:
- Download the report as one of the following file formats: Image (graphs/chart only), PDF, XLS and CSV.
- Duplicate a report/dashboard (available to Report Editors only).
- Edit Report (available to Report Editors only): From here Report Editors can access the Fields and Filters, Settings and Design, Report View FIlters, Drilldown Settings and Permissions and Save. For further details refer to Edit a report or dashboard.
- Report Details: To view the following details of the report such as: Description, Owner, Created On, Modified On and Report Location.
- Send by Email: To send the report in an email in one of the following file formats: Image, CSV, XLS and PDF.
- Subscription: To create and manage subscriptions.
- Delete (available to Report Editors only).
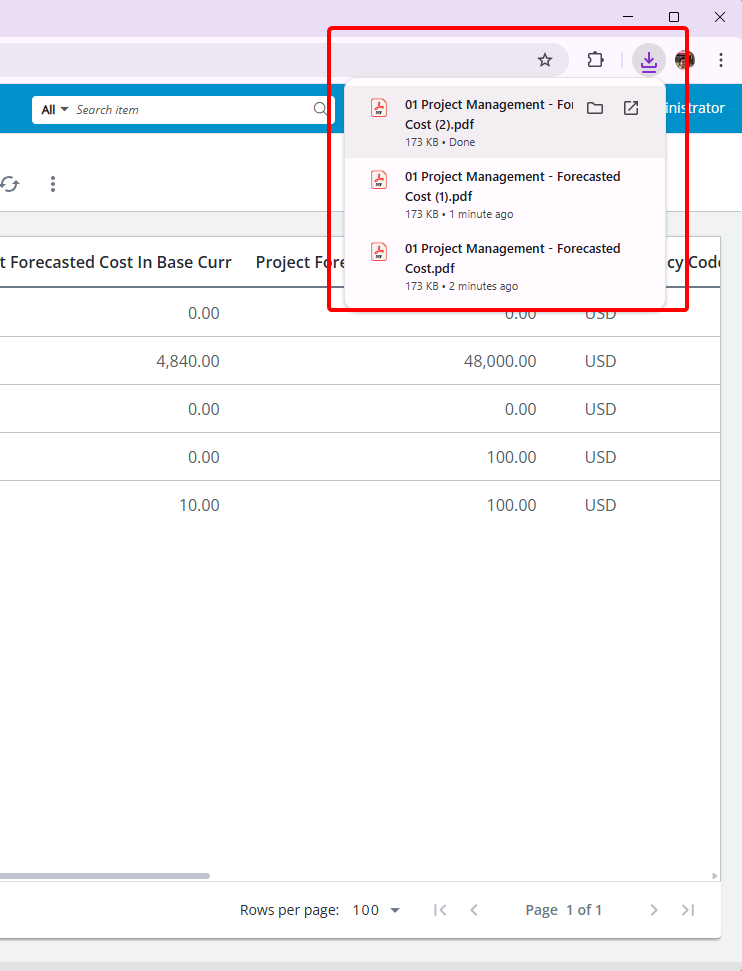
Prior to this release, users were accustomed to the typical browser experience—click Export and immediately see the file appear in the corner of the screen following the browser download processes.
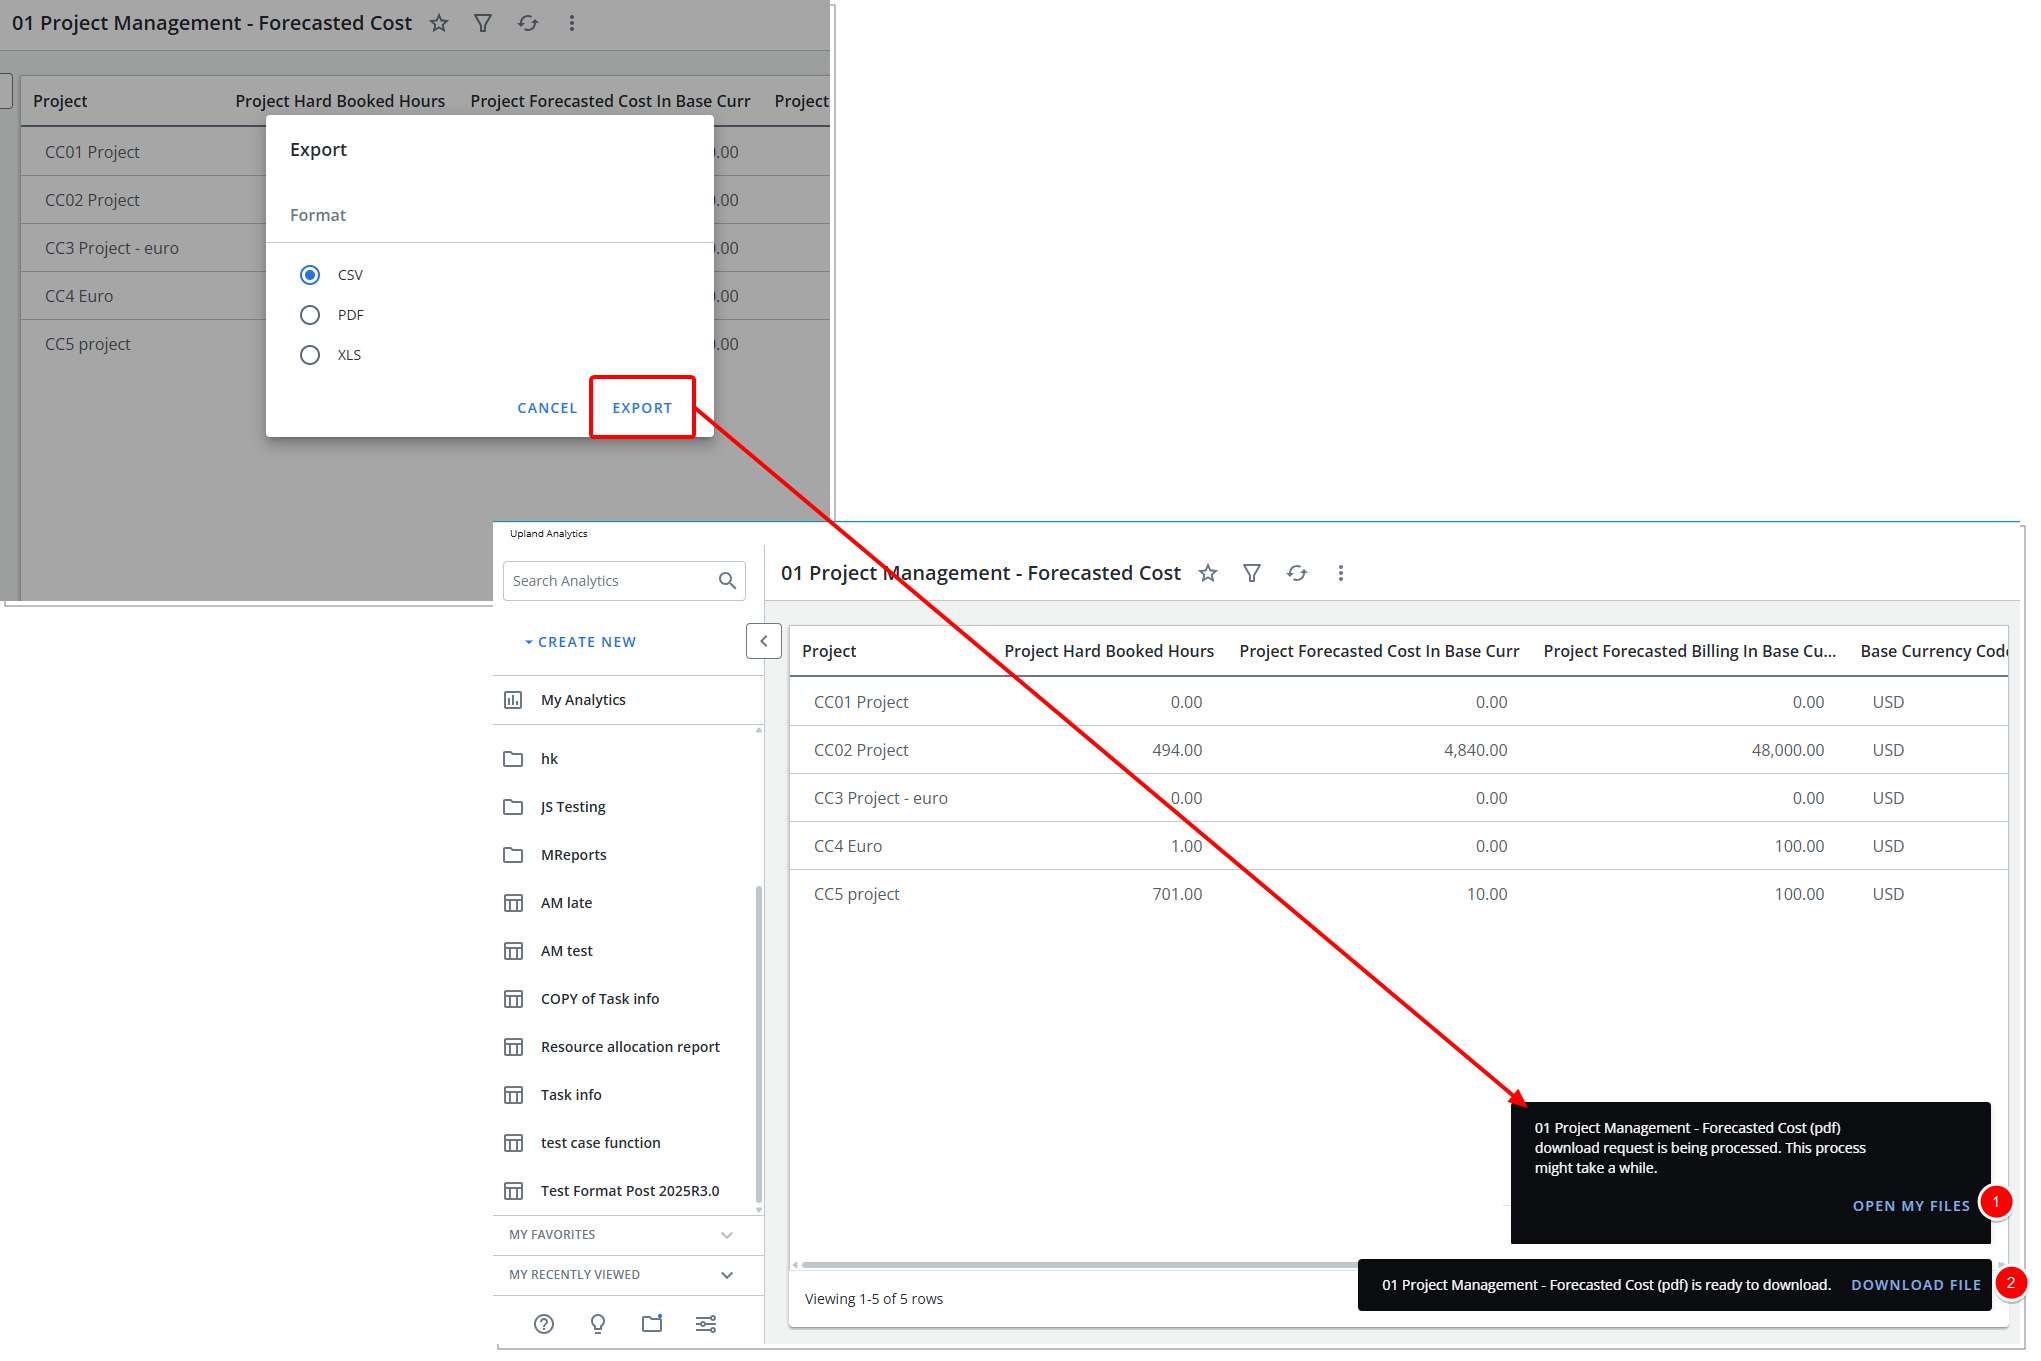
As of this release, the export process has changed. When you click Export, the file is first sent to a processing queue.
- A popup appears informing you that: {Report Name} download request is being processed. This process might take a while.
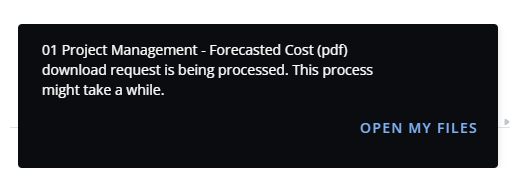
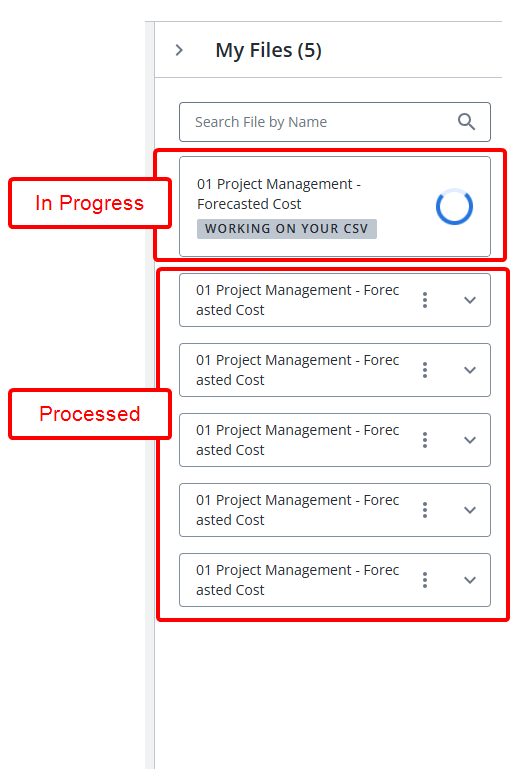
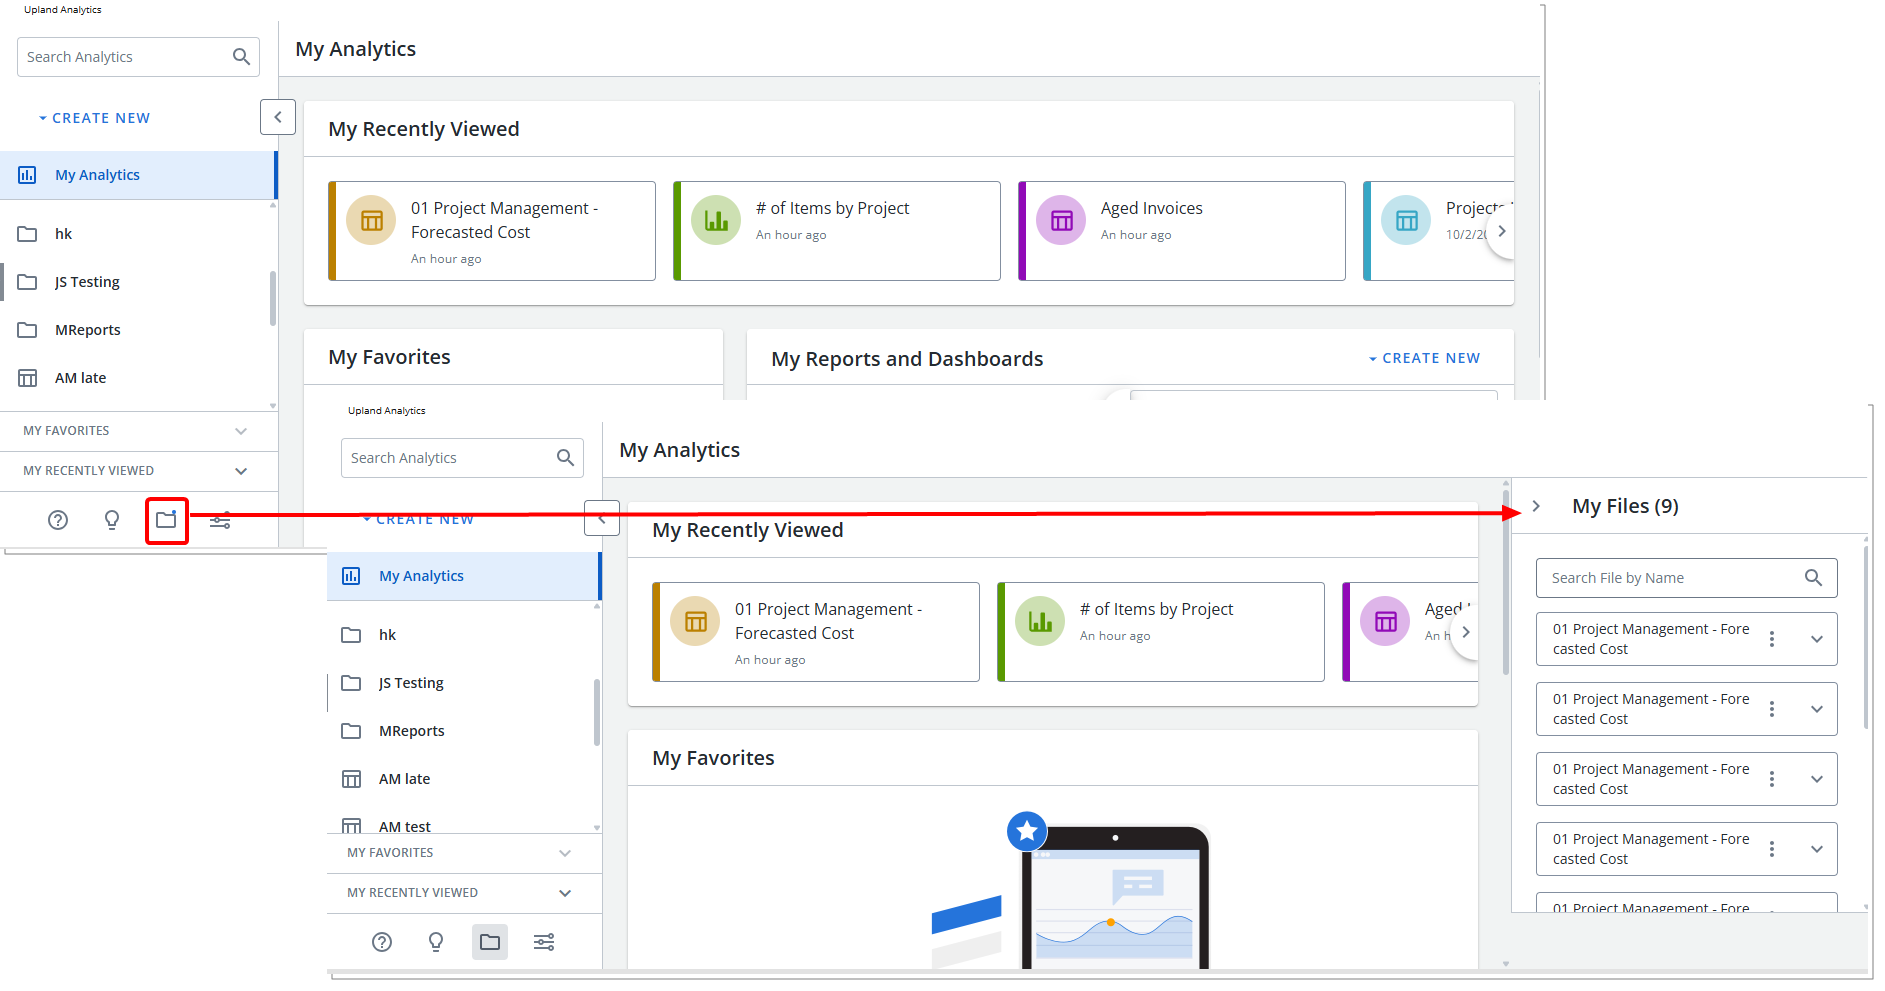
- You can click the Open My Files link in this popup which will open the My Files panel where you will see your previously exported Reports as well as your most recent export in progress.
Note: Processing times may vary depending on the complexity of the report and its position in the global processing queue.
- You can click the Open My Files link in this popup which will open the My Files panel where you will see your previously exported Reports as well as your most recent export in progress.
- If you remain on the page, a second popup will appear—once processing is complete—indicating that: {Report Name} is ready to download .
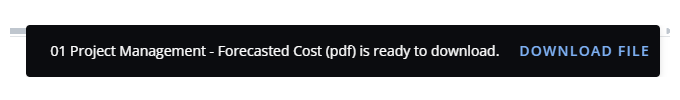
- Click the Download File link to start the browser download process.
- Click the Download File link to start the browser download process.
If you miss the popups or navigate away from Upland Analytics before the file is ready, you can retrieve the file directly from My Files in Upland Analytics.
Note: When new reports are ready in My Files, the My Files  button will display a blue dot to indicate that newly processed items are available.
For further details refer to the Upland Analytics help center:
Report Editors in Upland Analytics can create new folders.
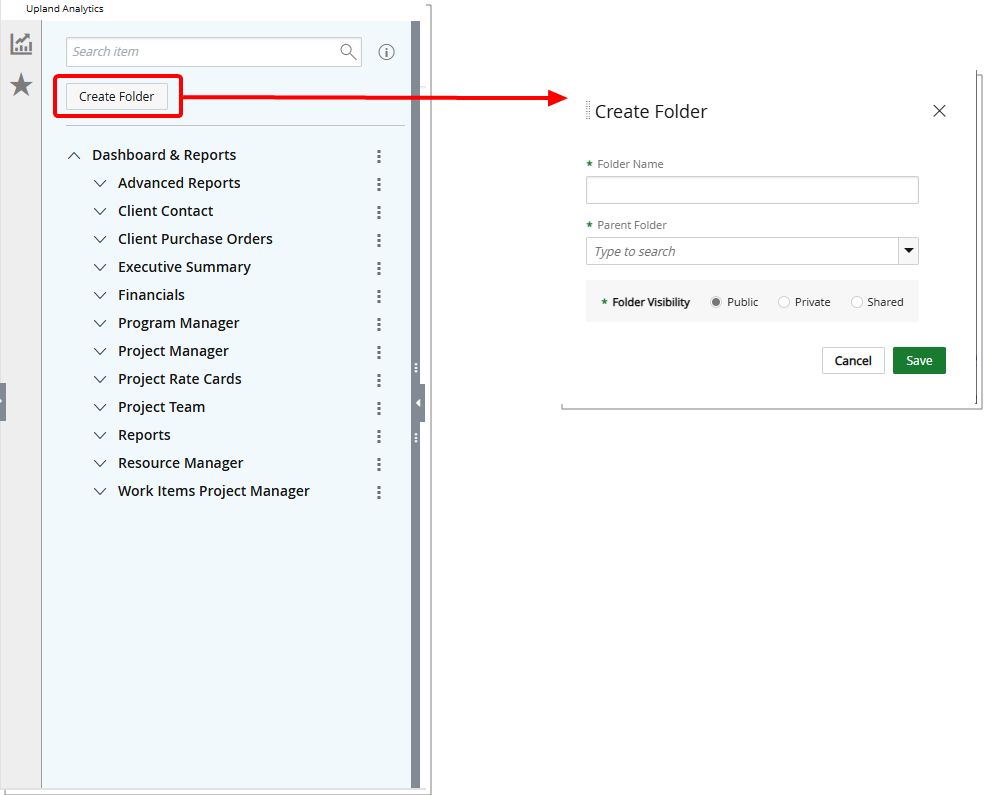
Prior to this release, the Create Folder button was located within the Analytics menu. In the updated interface, folder creation has been streamlined and relocated for improved usability.
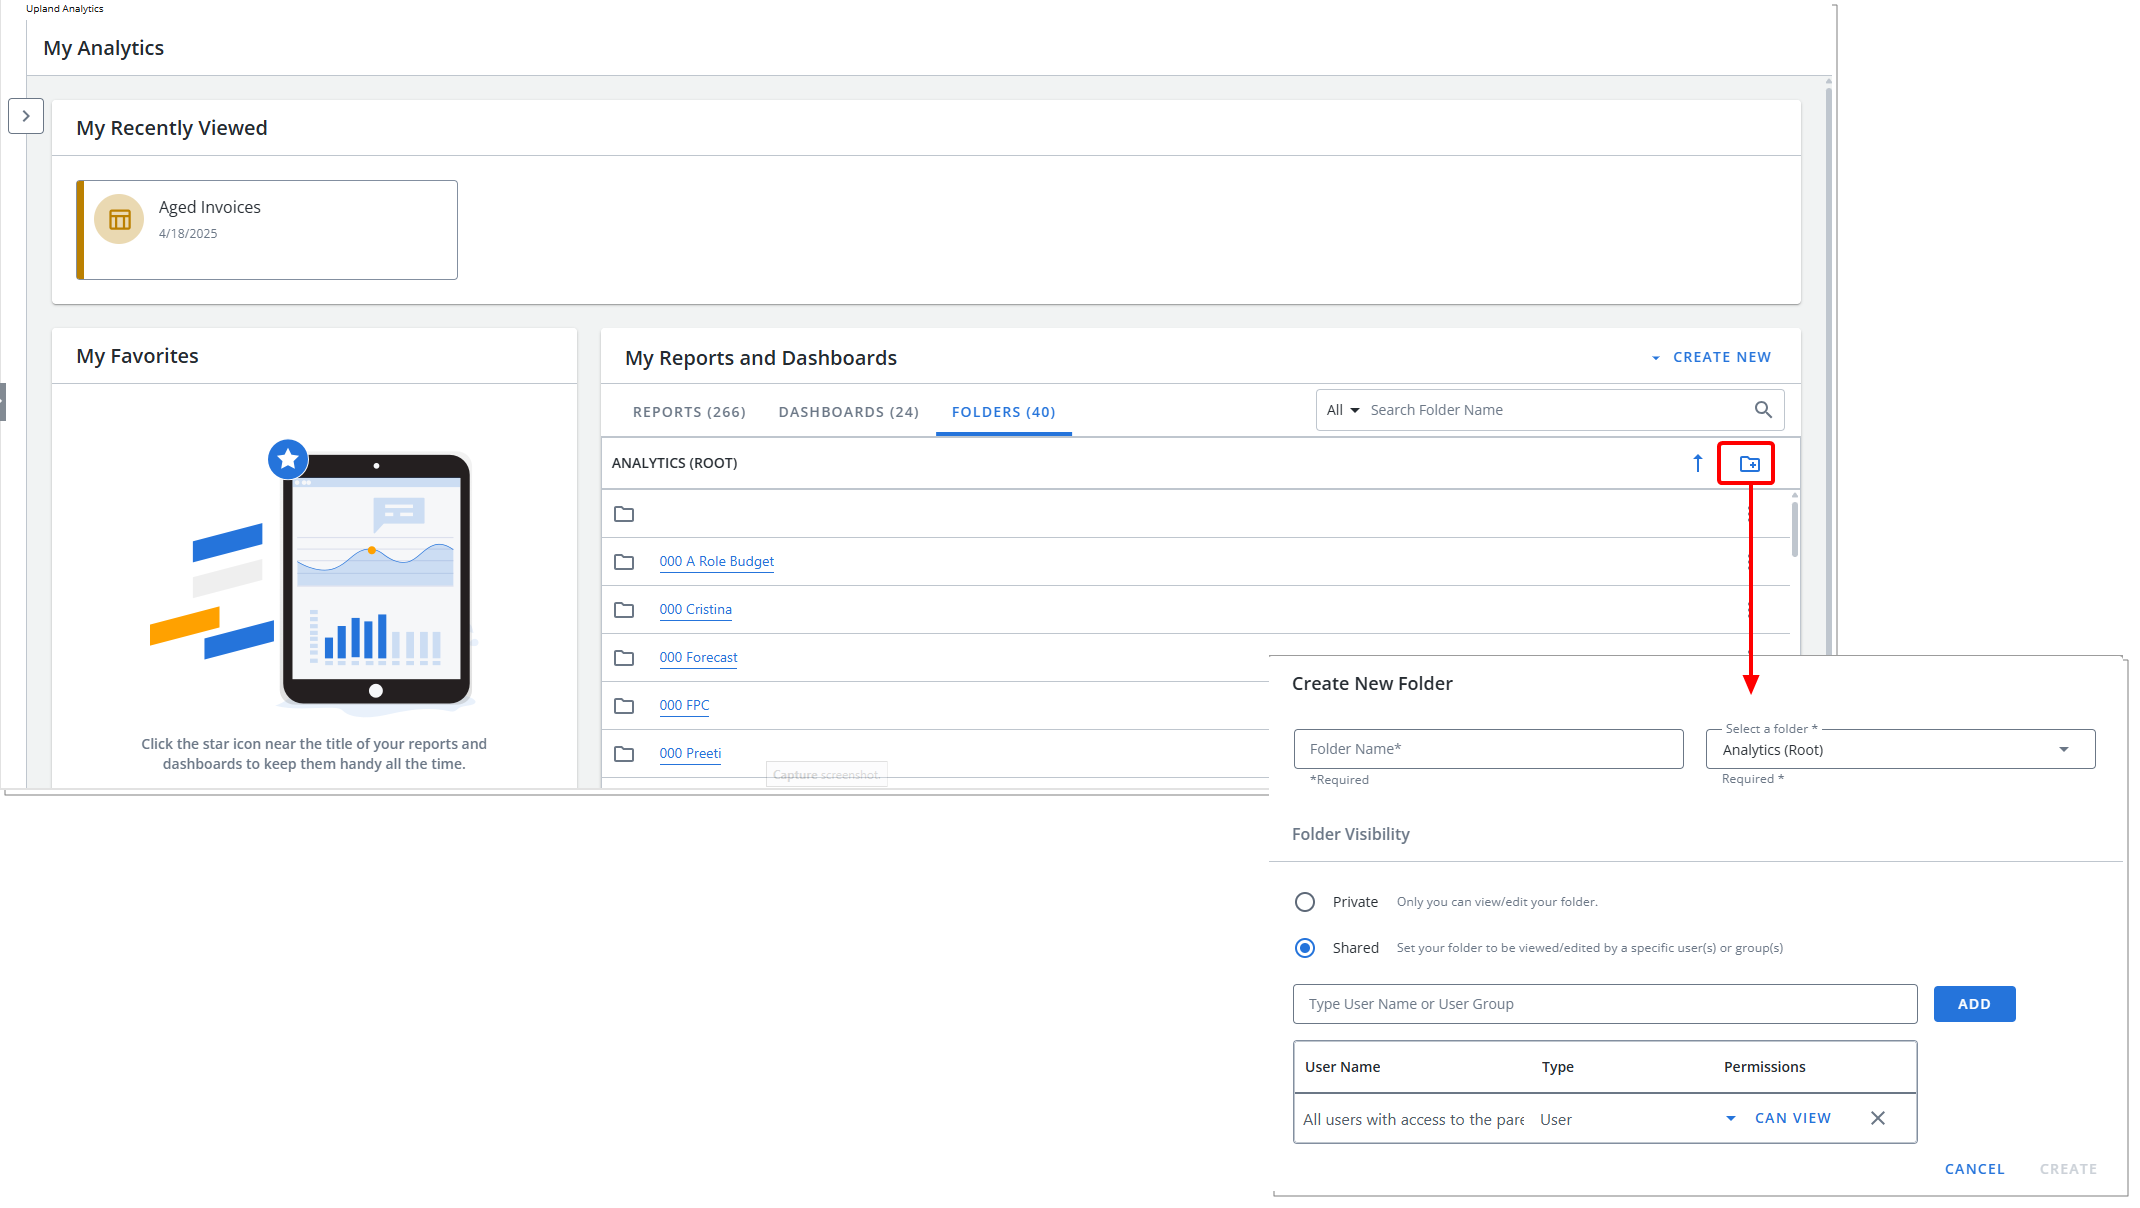
To create a folder in "NextGen" Upland Analytics, navigate to the My Reports and Dashboards section and select the Folders tab. Click New Folder to open the Create New Folder dialog box. In the dialog, enter a name in the Folder Name field. Then, use the Select a folder field to choose an existing folder where you want to place the new one.
for further details refer to Create a folder.
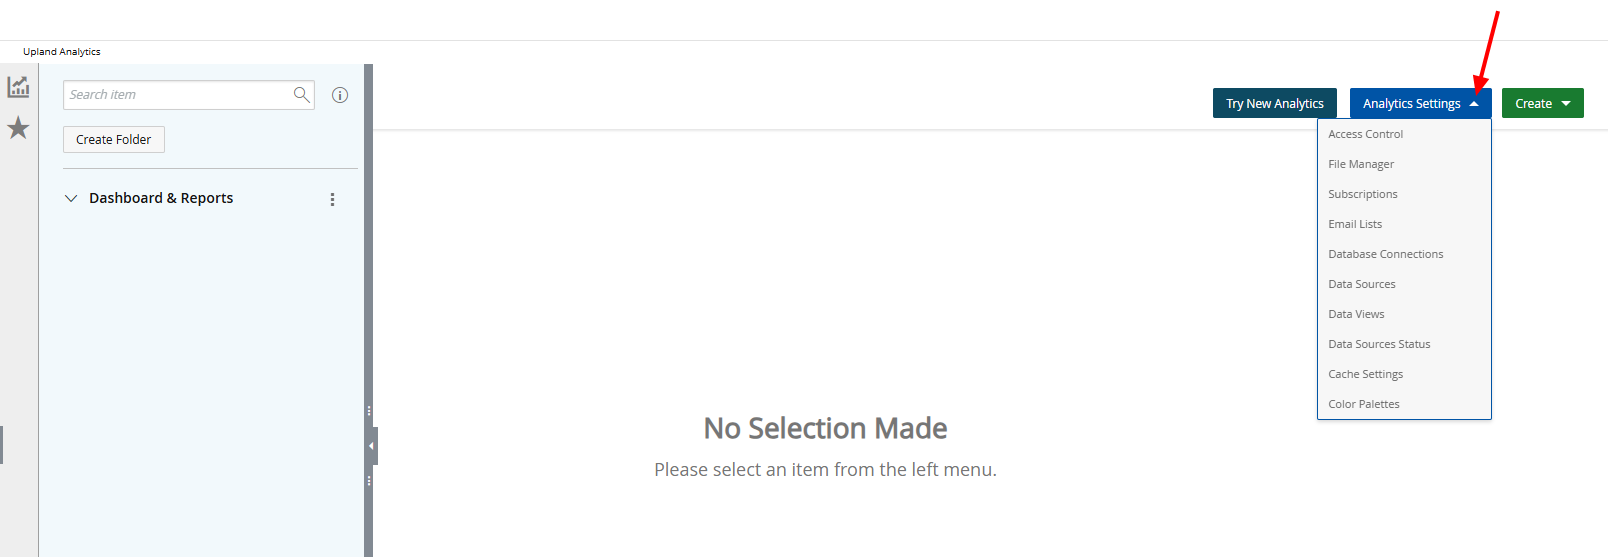
Prior to this release, the Analytics Settings dropdown list was accessible through the Main Menu bar.
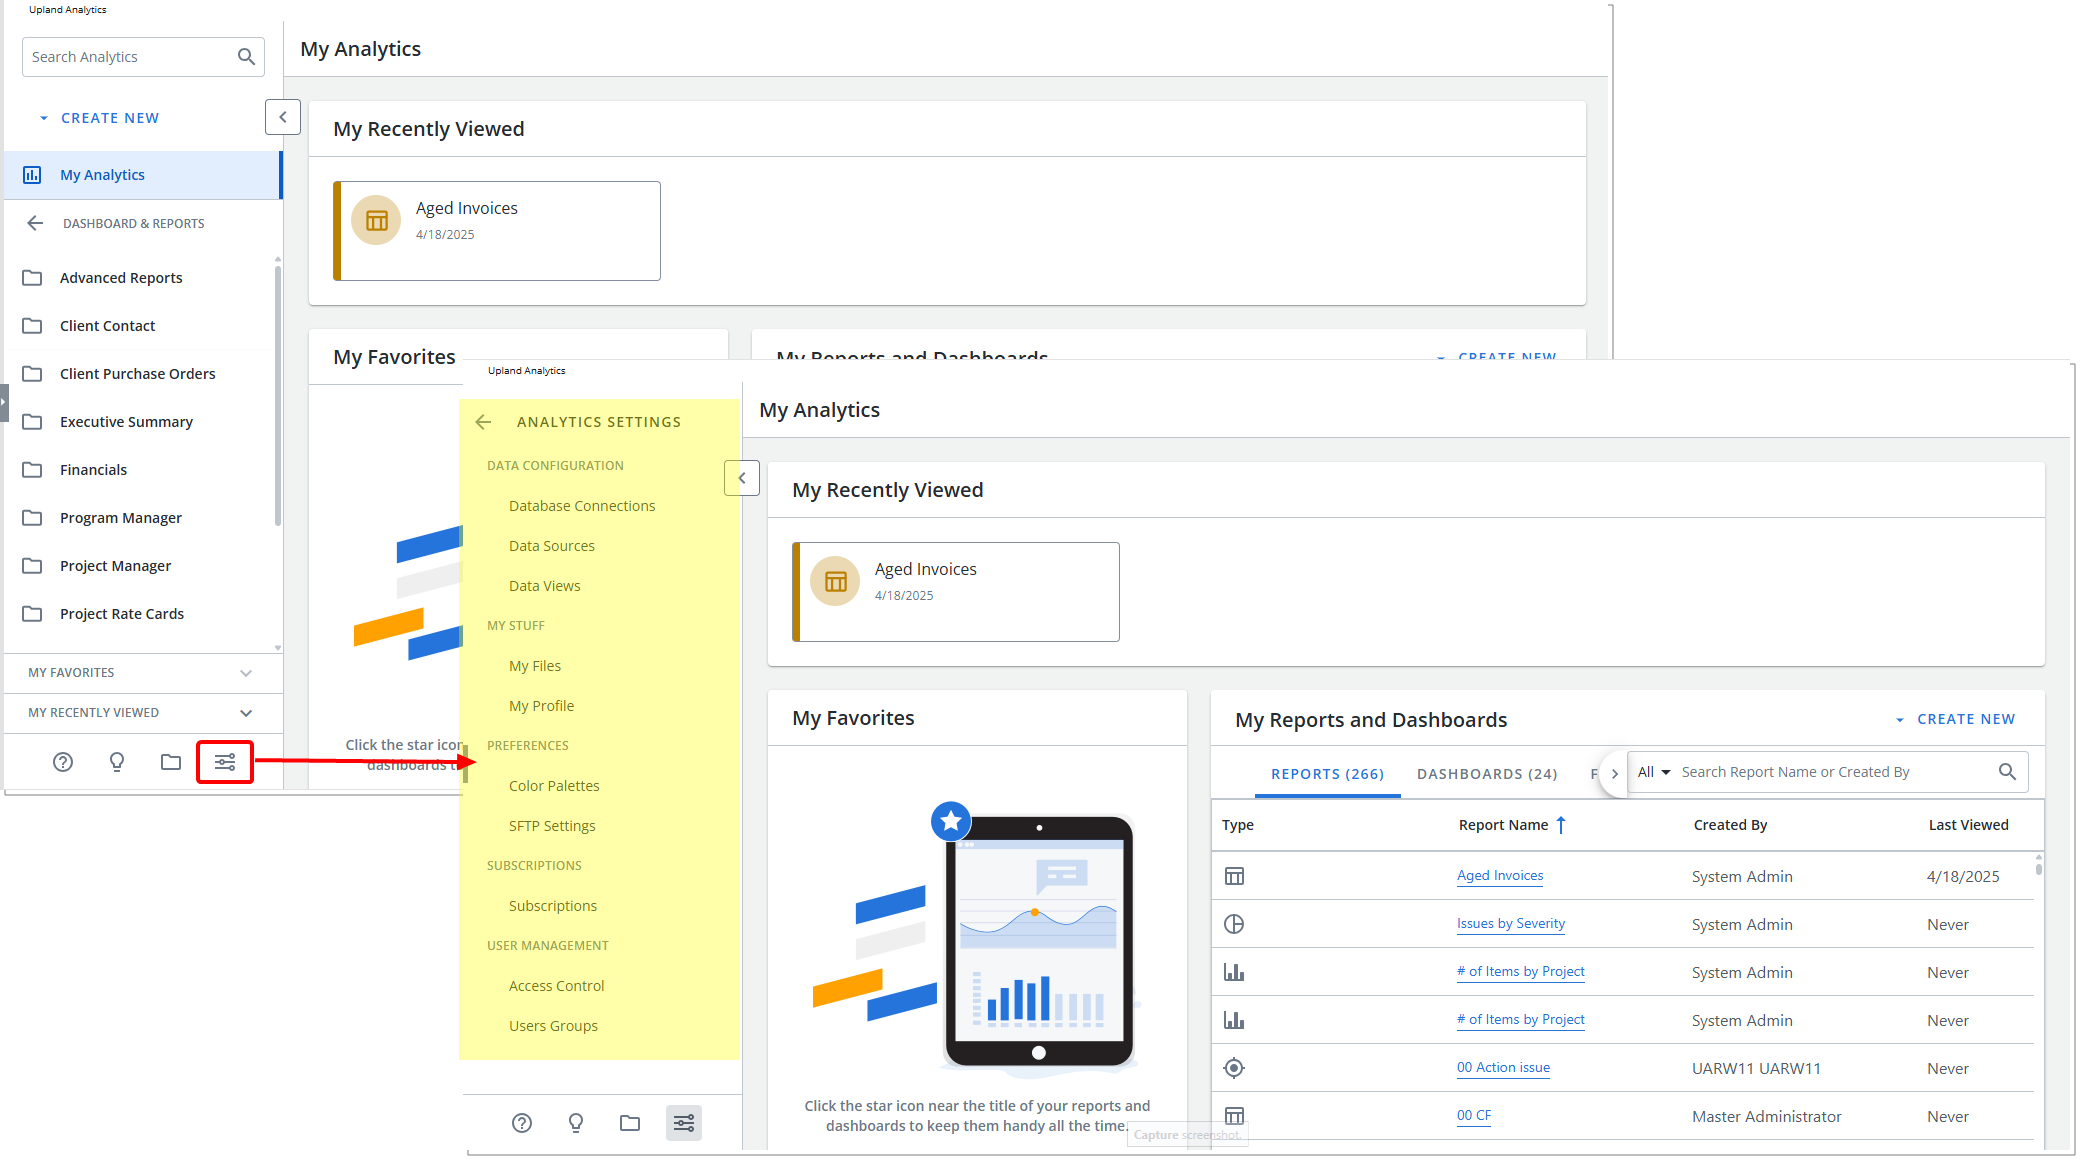
The Analytics Settings  button is now located at the bottom of the Analytics menu. Selecting this button opens a menu where you can manage various settings, including:
- Data Configuration: Database Connections, Data Sources, Data Views
- My Stuff: My Files, My Profile
- Preferences: Color Palettes, SFTP Settings
- Subscriptions
- User Management: Access Control, Users Groups
for further details refer to Administration.
Housekeeping and Transition Considerations
These notes highlight important cleanup and transition details as you move to NextGen Analytics.
Custom layouts created in earlier versions are not carried forward to "NextGen" Upland Analytics.
What's Changing:
Any saved custom layouts from earlier versions will be lost when transitioning to "NextGen" Upland Analytics.
What Still Works:
You can still adjust Column Order, Sort Order, and Column Width in tabular reports. However, these changes apply only to the current view and are not saved for reuse.
Potential Impact:
This may affect integrations that rely on specific column order. If you export tabular reports to another system, the column order may change when custom layouts are removed, causing issues with imports downstream.
Actions Required:
- Contact PSA Support to request a script identifying reports that used custom layouts.
- If column order is critical for integrations, manually update the affected reports to match the required structure before using them in "NextGen" Upland Analytics.
Subscriptions that include inactive Users create unnecessary entries in Subscription Manager and may cause longer lists to review and manage.
What Happens:
- Emails are NOT sent to inactive Users (the system automatically skips them as in previous releases).
- Active users will still receive their reports normally.
- Inactive users simply appear in your Subscription list, potentially making it longer to review.
Impact:
- This is purely a housekeeping opportunity with no functional impact.
- Removing inactive Users improves visibility and makes Subscription management more streamlined.
Action Recommended (Optional:
- Contact PSA Support to request a list of subscriptions with inactive users
- Consider removing inactive Users from Subscriptions for cleaner list management.
Old or unused reports may remain in your reporting environment and make it harder to manage active content.
Impact:
- Unused reports consume storage and may appear in search results, creating confusion.
- Cleaning up unused Reports makes it easier for Users to find the reports they need and improves overall performance.
Note: An unused report is defined as a report that has not been run manually by a User, included in a Dashboard, or delivered through a Subscription.
Action Recommended (Optional):
- Reports are typically considered unused if they have not been run for a year or more, although this threshold can be adjusted to meet your specific needs.
- Contact PSA Support to request a list of unused reports.
- Retire any reports that are no longer required.