PSA 2025 R3.1 - Product Enhancements
PSA 2025 R3.1 is set to be deployed to your staging sites on January 07, 2025. Production sites are set to be upgraded on January 25, 2025. The listed Enhancements will become available to you upon upgrading to 2025 R3.1.
2025.07.11.2025R20.V1.EB
Note:
- This page may be updated as new information becomes available. Visit this page regularly for the latest updates.
- Screenshots and examples are for illustration only. Your environment may appear differently depending on your organization’s configuration, access permissions, and feature settings.
Customizable Homepage Templates
In 2025 R3.0, we introduced customizable Home Page Templates to streamline the way you access your work, providing role-specific dashboards and real-time visibility into Projects, Tasks, and approvals. Building on that foundation, we are now enhancing the capabilities and flexibility of Home Pages, enabling administrators to configure richer KPIs, integrate additional data sources, and offer more meaningful insights at a glance.
These improvements help you focus on what matters most, make timely decisions, and get work done more efficiently—right from your personalized Home Page.
Description: In the previous release, administrators managing Home Page Templates had no quick way to duplicate an existing template. Creating similar layouts required manually recreating widgets, grid placements, and configurations, which was time-consuming and prone to errors.
With this release, a Copy ![]() option has been added to the Homepage Templates list page.
option has been added to the Homepage Templates list page.
- Navigate to the Homepage Templates list page
- Select the checkbox next to the Template you want to copy.
- Click the Copy
 button.
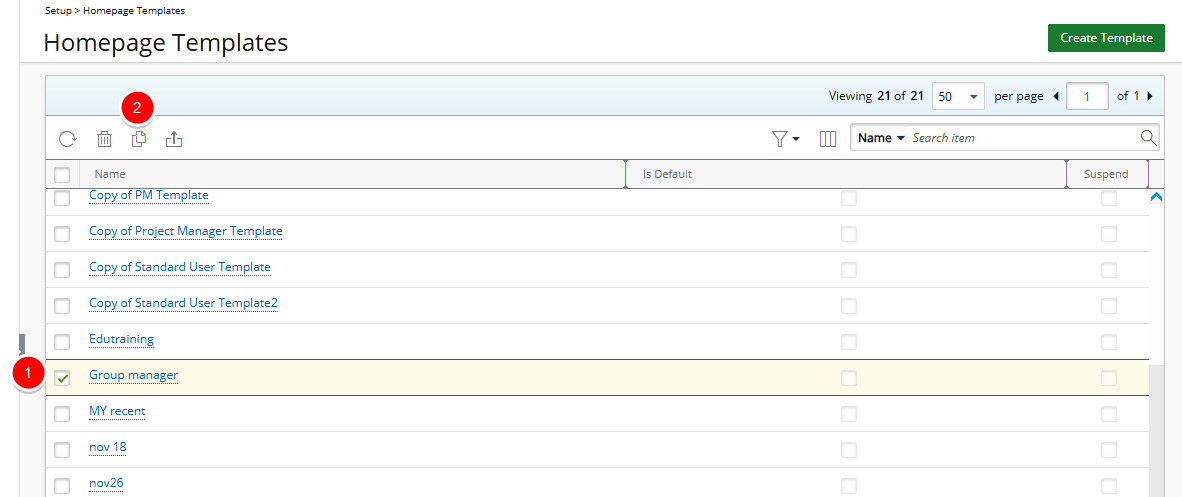
- The copied template is created and displayed immediately with the name “COPY of [Original Template Name]”. The General tab opens automatically.
- On the General tab, you can update the template Name and adjust the Is Default or Suspend options.
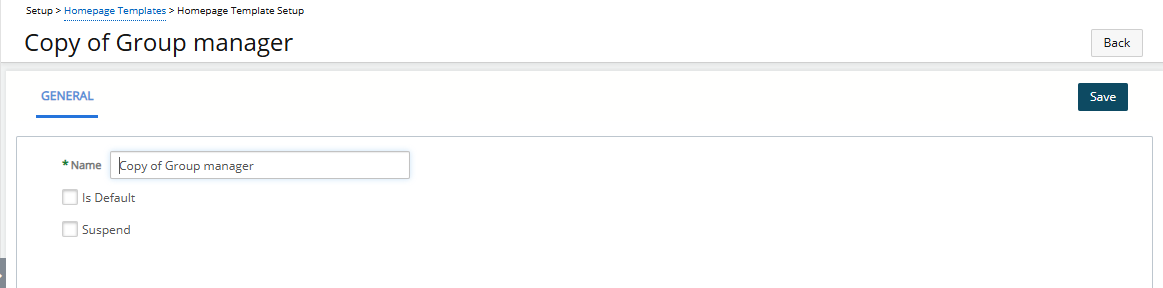
- Click Save to confirm your changes.
- After saving, the Designer and Associations tabs become available.
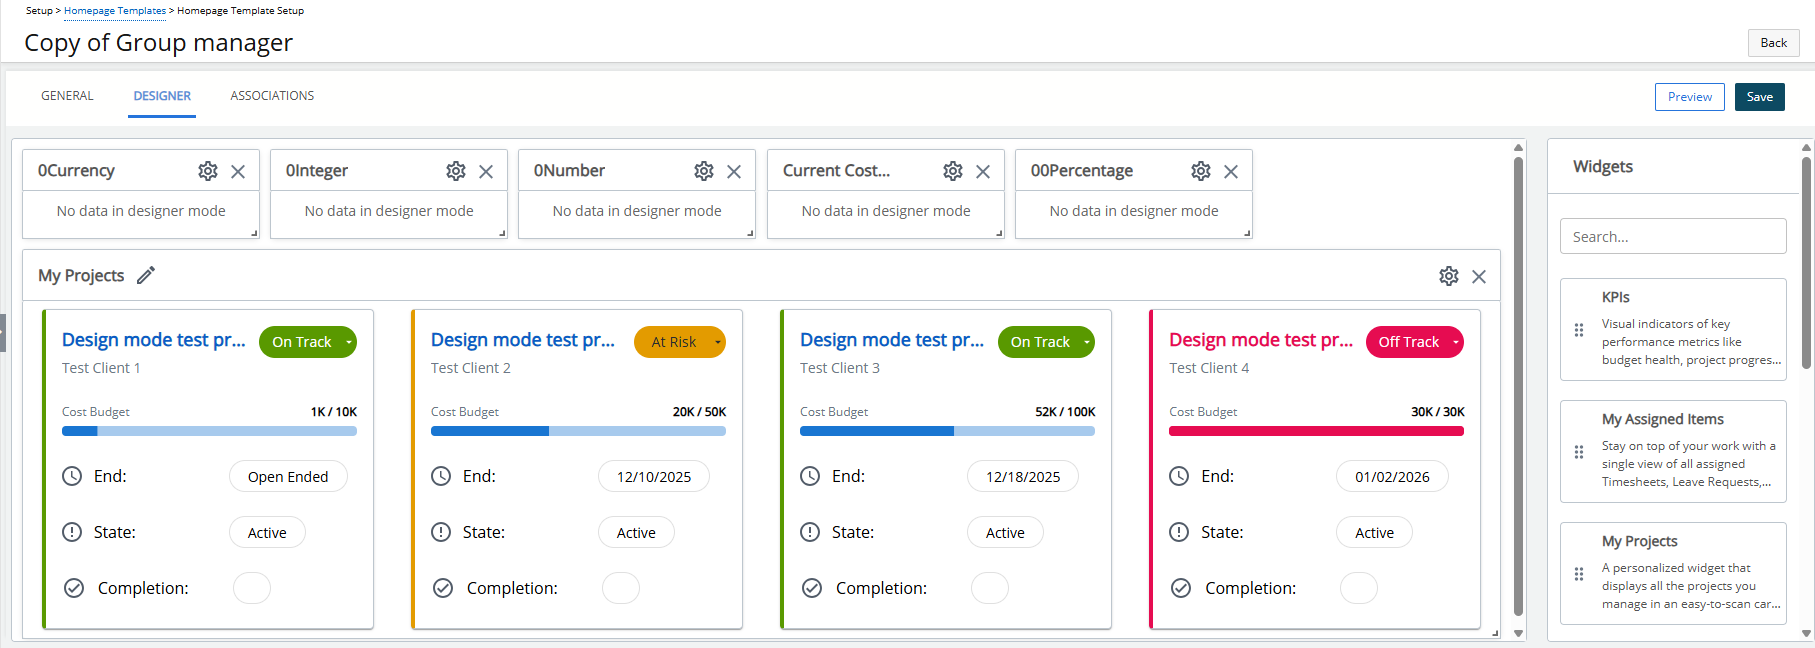
- Navigate to the Designer tab to verify that all Widgets, their layout, and configurations from the original template are preserved.
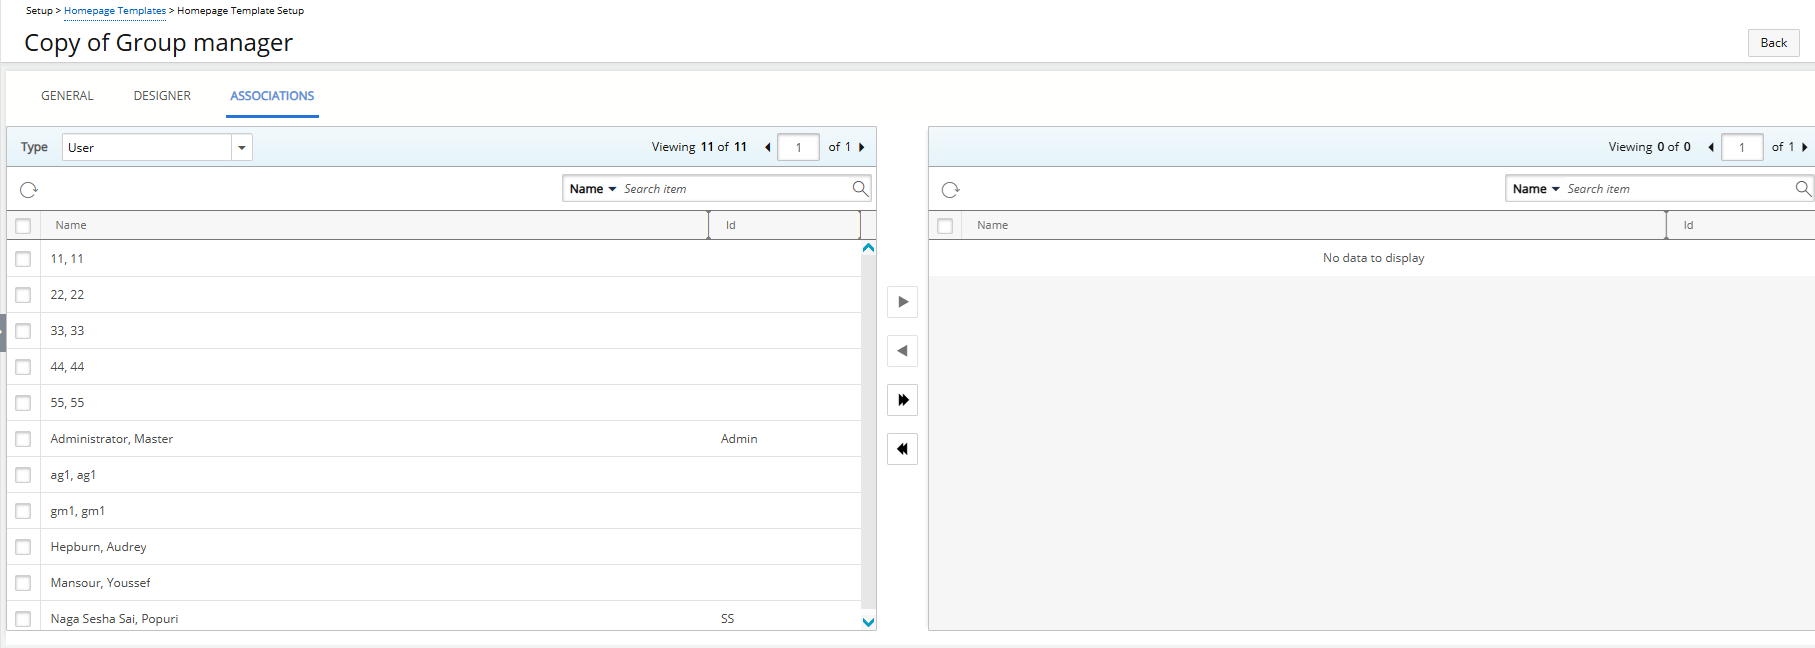
- Navigate to the Associations tab to note that associations from the original template are not copied and need to be set manually.
Benefit: This improvement streamlines template management, reduces setup time, and ensures consistency across similar Home Page layouts.
For more information see Copy a Homepage Template.
Description: In the previous release, administrators configuring Homepage Templates in the Designer tab had no way to preview the layout and widget setup before publishing. This often made it difficult to verify the visual arrangement, widget behavior, and KPI or filter configurations, requiring multiple edits and republishing to ensure the page appeared as intended.
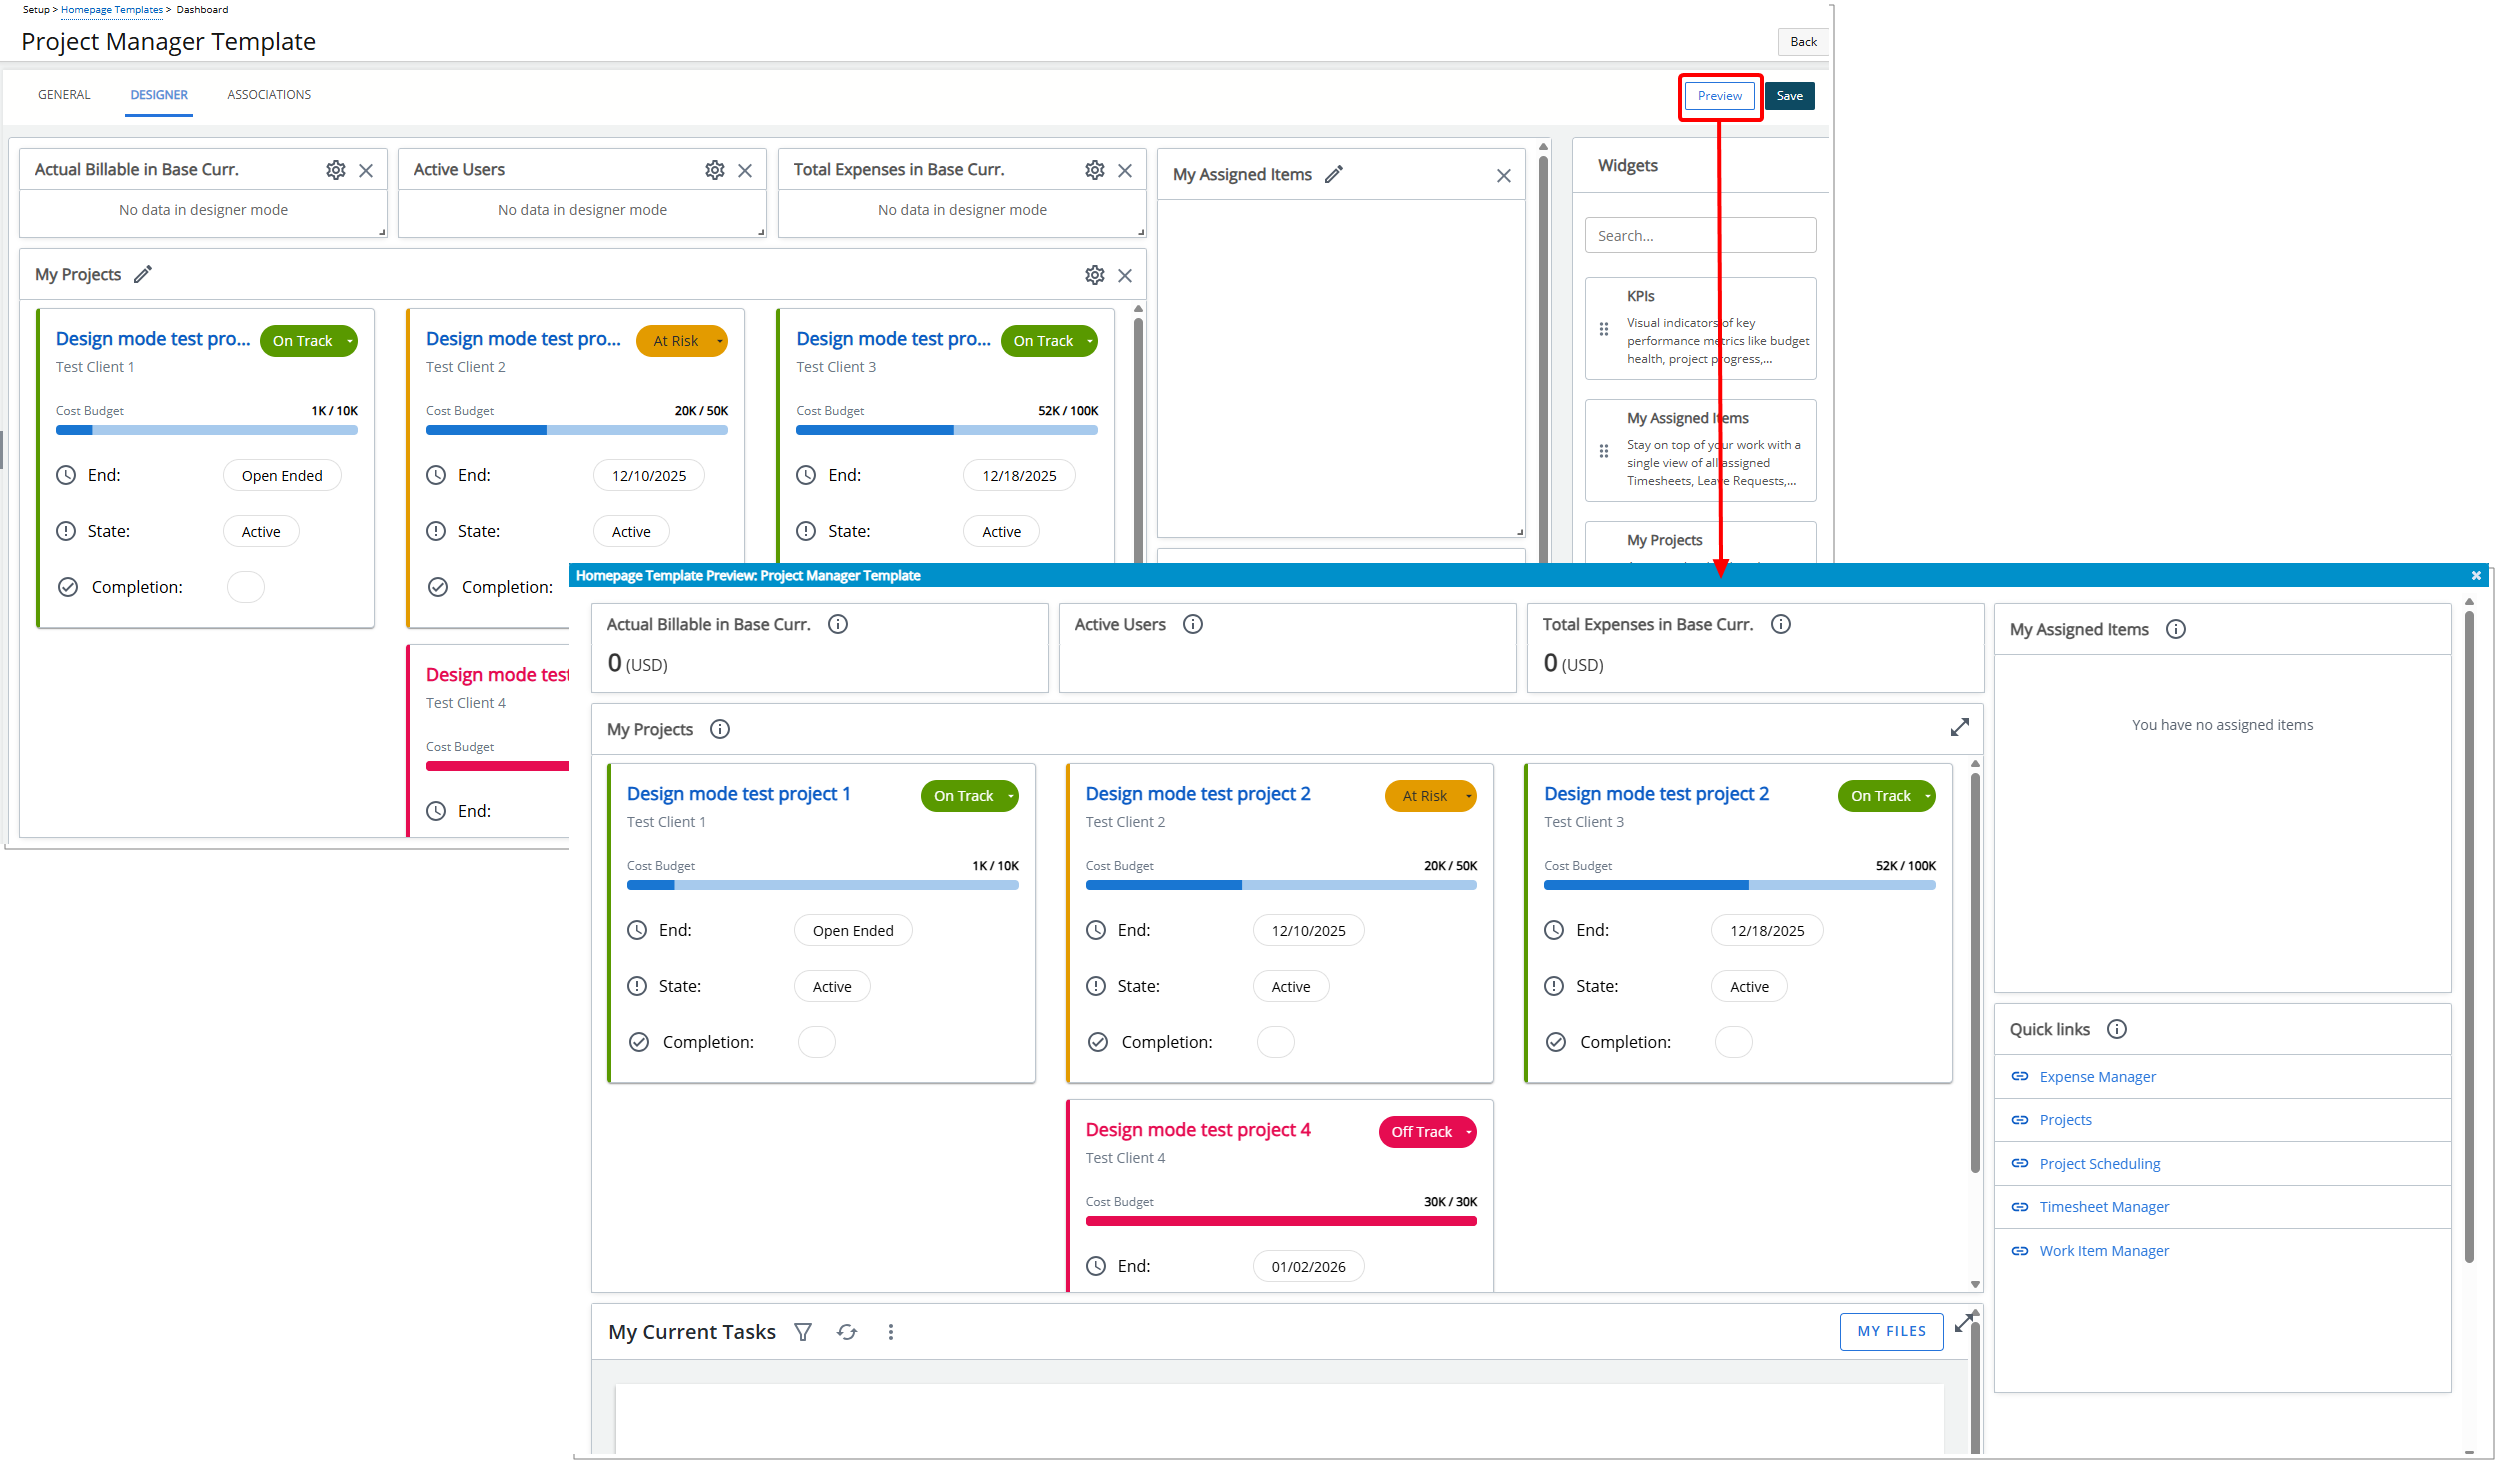
With this release, a Preview button has been added to the Designer tab, allowing you to see a live, read-only rendering of the homepage directly from the Designer.
When clicked, the Preview mode displays all configured widgets, their order, size, layout, and any KPIs or filters with placeholder data, exactly as an end user would see them. The preview opens in a modal window, providing a clear view without altering the Designer state.
If you want to make a change, you can close the modal window, return to the Designer, update the layout or widget configuration, and click Preview again to immediately see the updated design without needing to save first.
Benefit: This enhancement improves efficiency and accuracy by enabling administrators to validate the homepage design in real time. It ensures visual consistency, reduces trial-and-error adjustments, and gives confidence that the published homepage will match the intended layout and functionality for end users.
For further details see:
Description: The My Recent Reports widget provides users with quick access to recently viewed Reports and Upland Analytics Reports. This allows users to open frequently accessed reports directly from the Homepage without navigating through menus or search.
Configuration
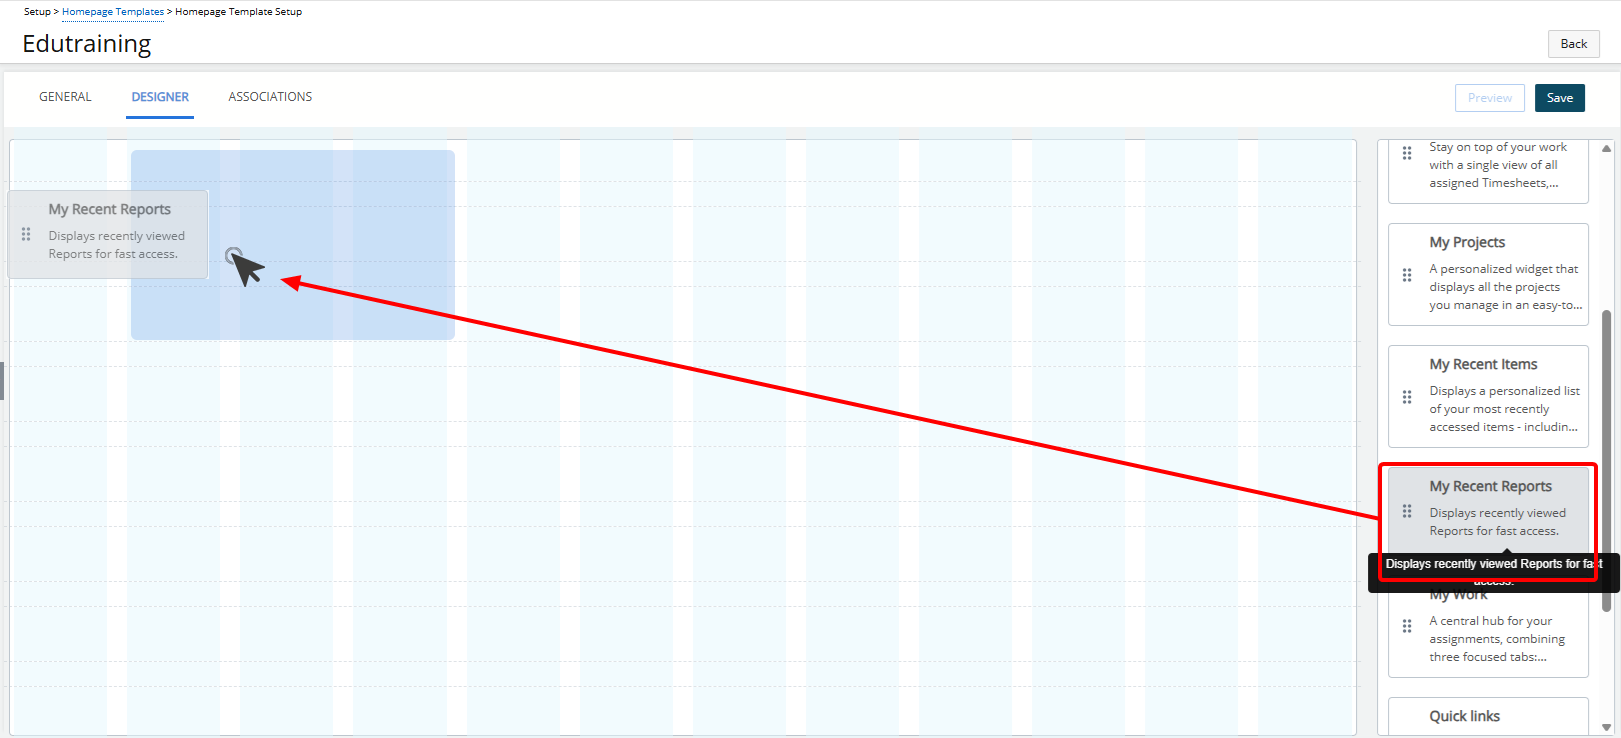
- Select the My Recent Reports widget from the Widget library.
- Place it on the desired area of the Homepage Designer layout.
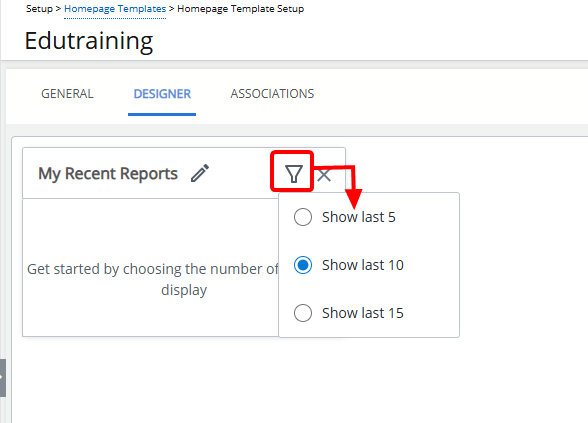
Administrators can control how many recently viewed reports appear in the widget:
- Click the Filter
 button.
 - Then choose:
- Show last 5
- Show last 10 (default selection)
- Show last 15
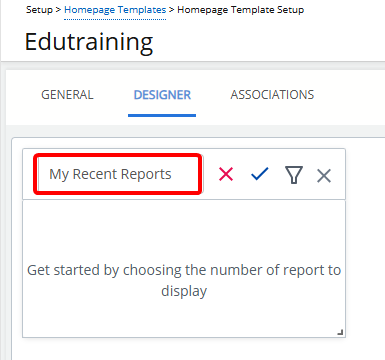
- Click the pencil icon (
 ) to rename the widget title.
 - Click the check mark (
 ) to confirm the name and save the template automatically.
 - Click the X icon (
 ) to cancel.
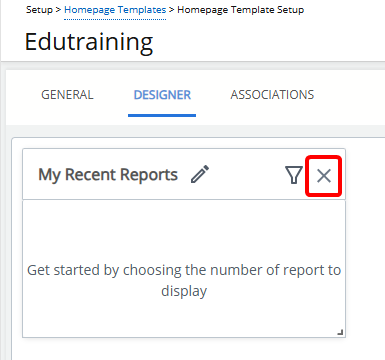
Click the Delete ![]() icon. The widget is removed from the Homepage.
icon. The widget is removed from the Homepage.
End User Experience
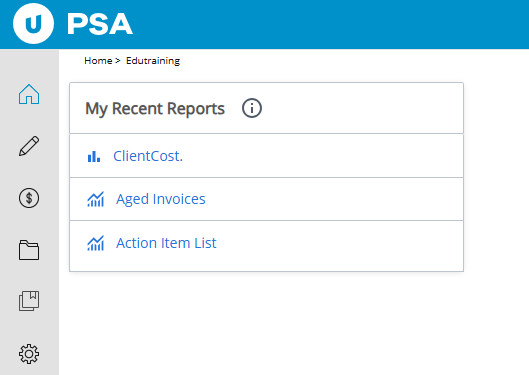
The My Recent Reports tile provides you with quick access to the reports you use most often, displaying up to 5, 10 (default), or 15 recently visited reports in descending order by last visited time.
Each report name is a clickable link that opens the report directly, while distinct icons differentiate RDLC (![]() ) and UA (
) and UA (![]() ) reports for easy identification.
) reports for easy identification.
Note: If no recent reports are available, the tile displays a message indicating that no reports have been viewed recently. In cases where data cannot be retrieved due to connectivity or other issues, a clear error message is shown, ensuring you are always informed of the widget’s status.
Benefit: This widget improves efficiency by giving users immediate access to the reports they use most, reducing the time spent searching for frequently accessed content.
for further details refer to My Recent Reports Widget.
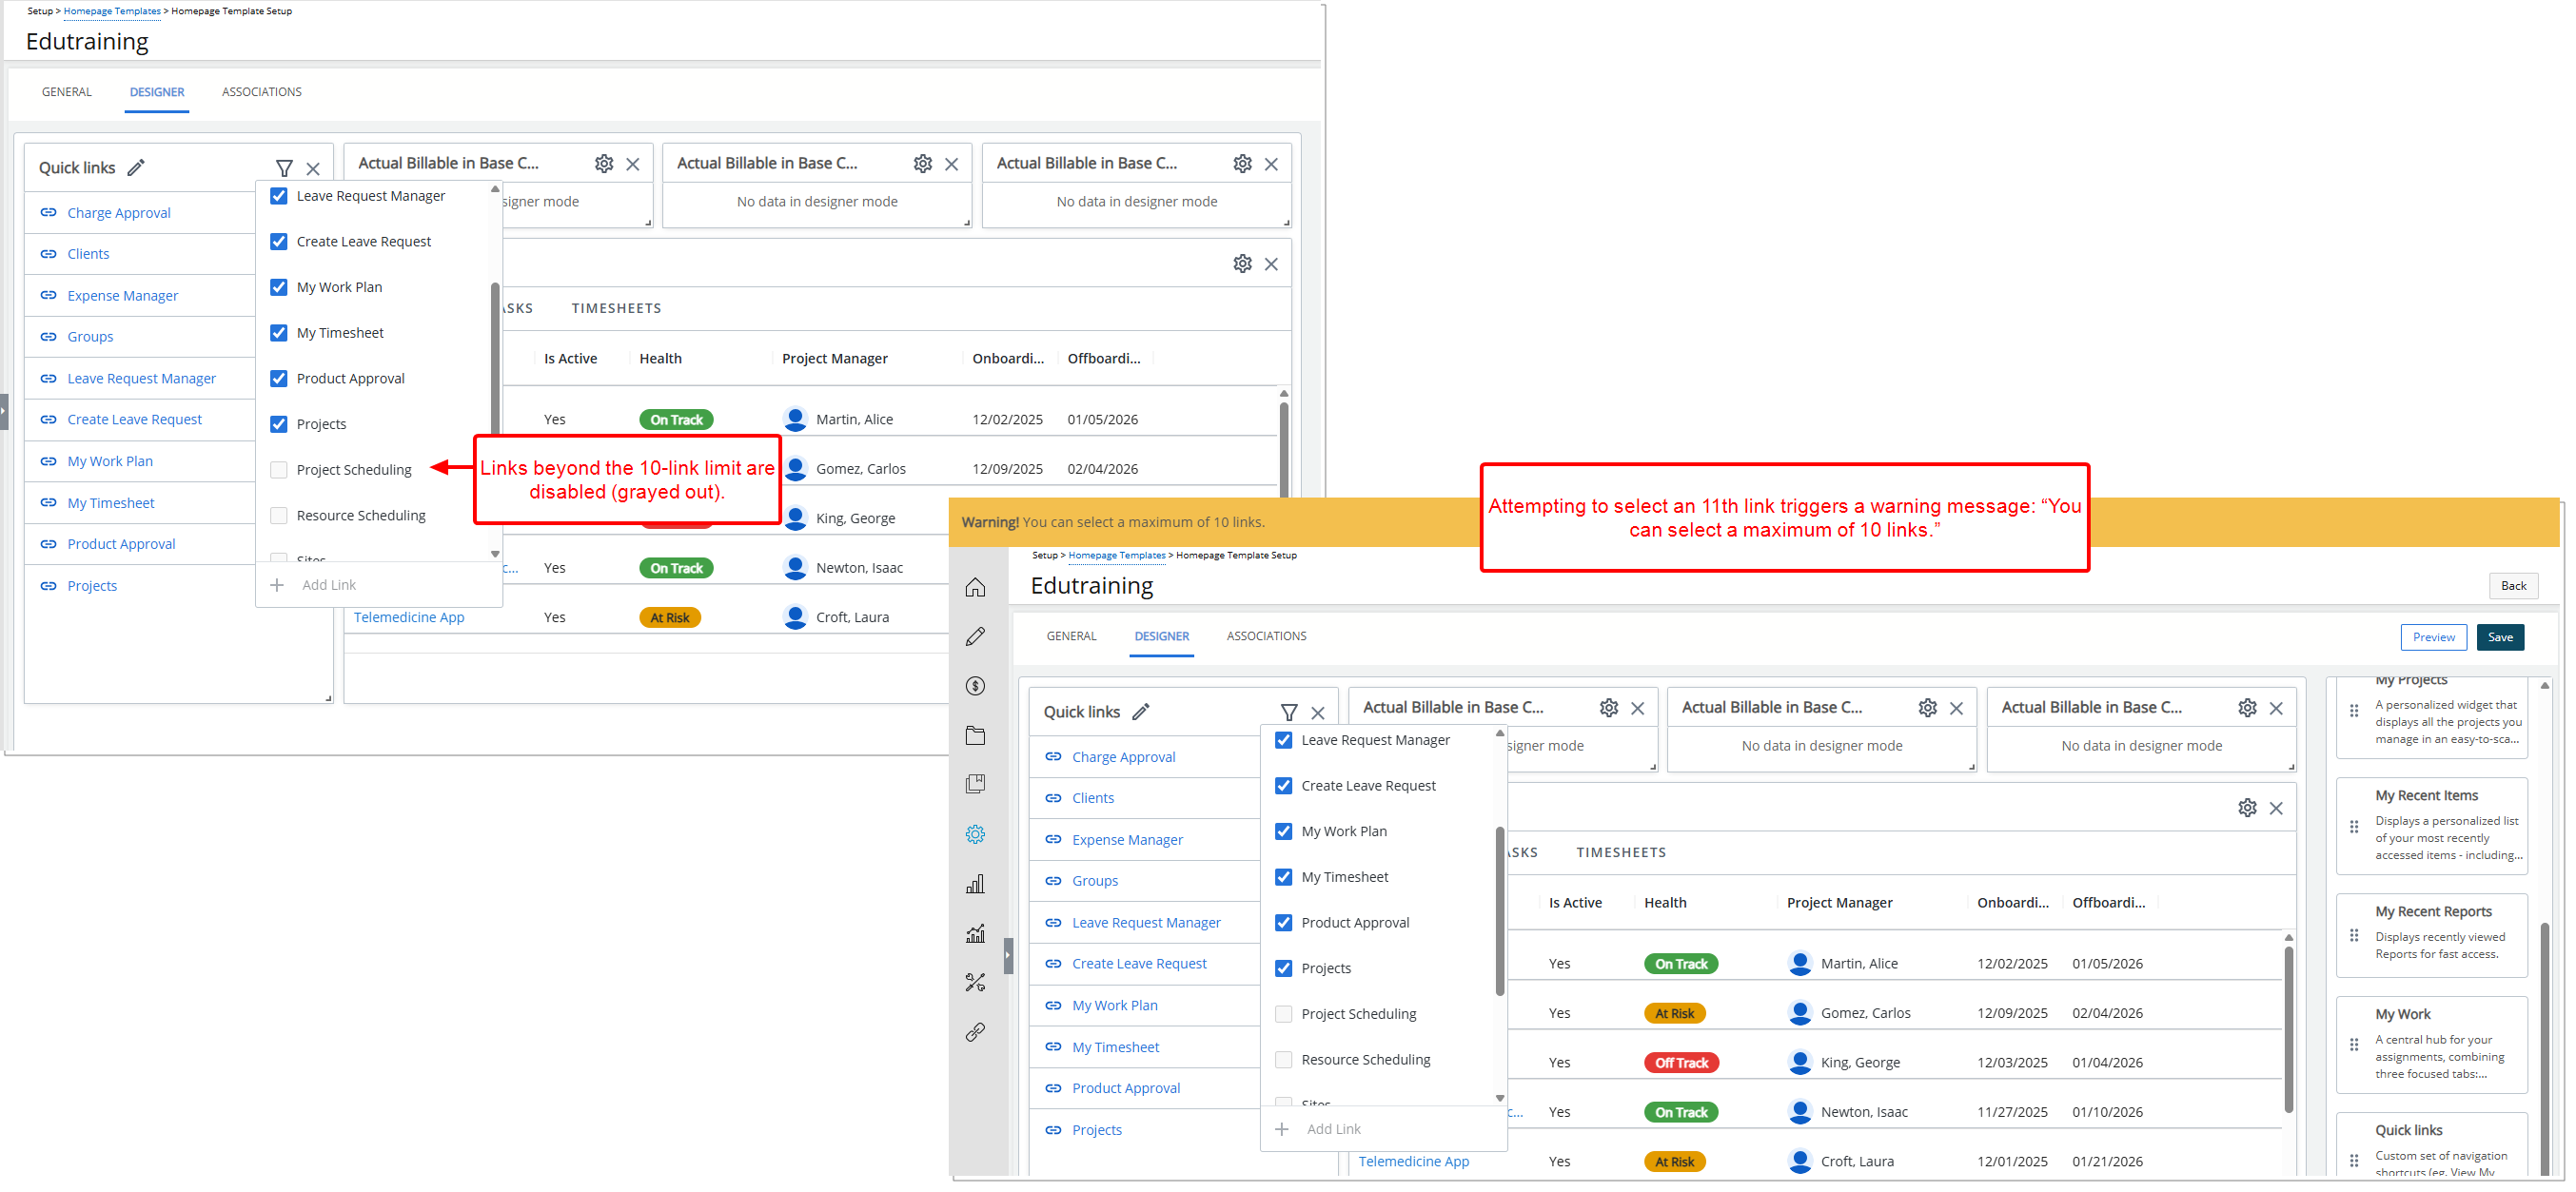
Description: In the previous release, when configuring the Quick Links Widget, a warning message appeared immediately upon selecting the 10th link, even though the user was still within the allowed limit. This caused confusion, as the warning appeared prematurely and all remaining link options were disabled before the user attempted to exceed the limit.
The behavior has been refined so that you can now select up to 10 links without any warning message. All remaining options remain visible but are disabled once the 10-link limit is reached. The warning message — You can select a maximum of 10 links. — now only appears when you attempt to select the 11th link, ensuring alerts are shown only when necessary.
Benefit: This enhancement improves the user experience by allowing you to configure the Quick Links widget without being interrupted by premature warnings.
For further details see Quick Links Widget.
The My Projects Widget has been enhanced with new configuration options that provide greater control over how project data is displayed on the Homepage. These improvements expand visibility into project budgets and KPIs, allowing administrators to tailor what information appears on each project tile and how it is presented. Users benefit from clearer, more relevant insights at a glance, while administrators gain flexibility to align the widget with organizational reporting needs.
Click a title below to explore each improvement in detail.
Description: Previously, the My Projects widget displayed all assigned projects in a single, continuous list. For users with a large number of projects, this could lead to slower load times and make navigation more cumbersome on the Home Page.
As of this release, the My Projects widget now supports pagination, displaying projects in pages of up to 25 items each. This change improves performance while preserving the existing project sort order, ensuring a familiar and consistent viewing experience.
End-User Experience:
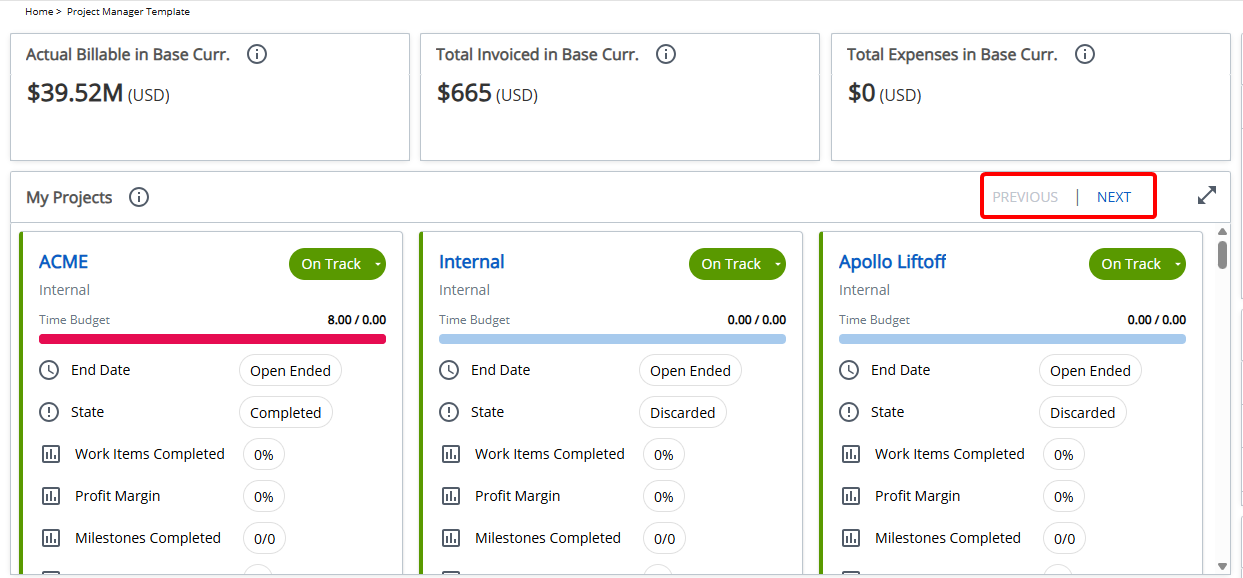
The My Projects widget displays up to 25 projects per page. When more than 25 projects are available, the Next button is enabled to load additional projects. When viewing any page beyond the first, the Previous button is enabled to allow navigation back. If fewer than 25 projects are available, both navigation buttons remain disabled.
Benefit: Pagination improves Home page performance and responsiveness for users with many projects, reduces initial load time, and makes it easier to browse project lists in manageable segments while maintaining the existing project order and behavior.
Description: In the previous release, the My Projects Widget displayed only a single budget metric (Cost Budget), limiting the visibility of other important budget-related information.
With this release, the widget has been enhanced to allow you to select which budget metric is displayed on the tiles, including Cost Budget, Time Budget, Billable Budget or Non-Billable Budget.
In addition, a newly added Time Range selector lets you control which projects are shown based on their end date, making it easier to focus on projects ending within a defined period.
By default, the widget continues to show the Cost Budget if no selection is made:
- From the Homepage Designer layout area, click Configure
 My Projects Widget.
 - In the Details tab.
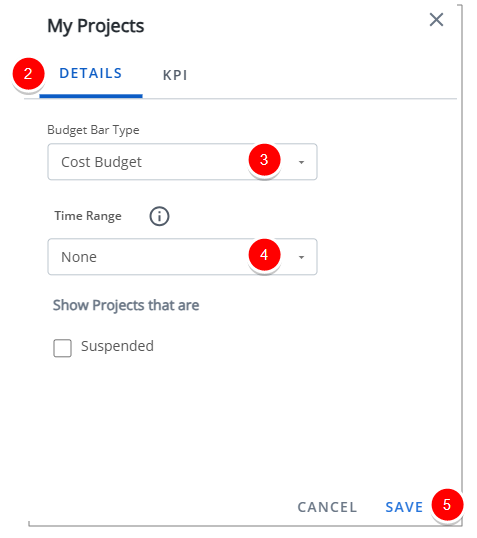
- Select the required option for Budget Bar Type. The available options are:
- Cost Budget
- Time Budget
- Billable Budget
- Non-Billable Budget
- From the newly added Time Range selector, choose to show projects that end within one of the following periods (default: None): Next 7 days, Next 30 days, or Next 60 days.
- Click Save.
End-User Experience:
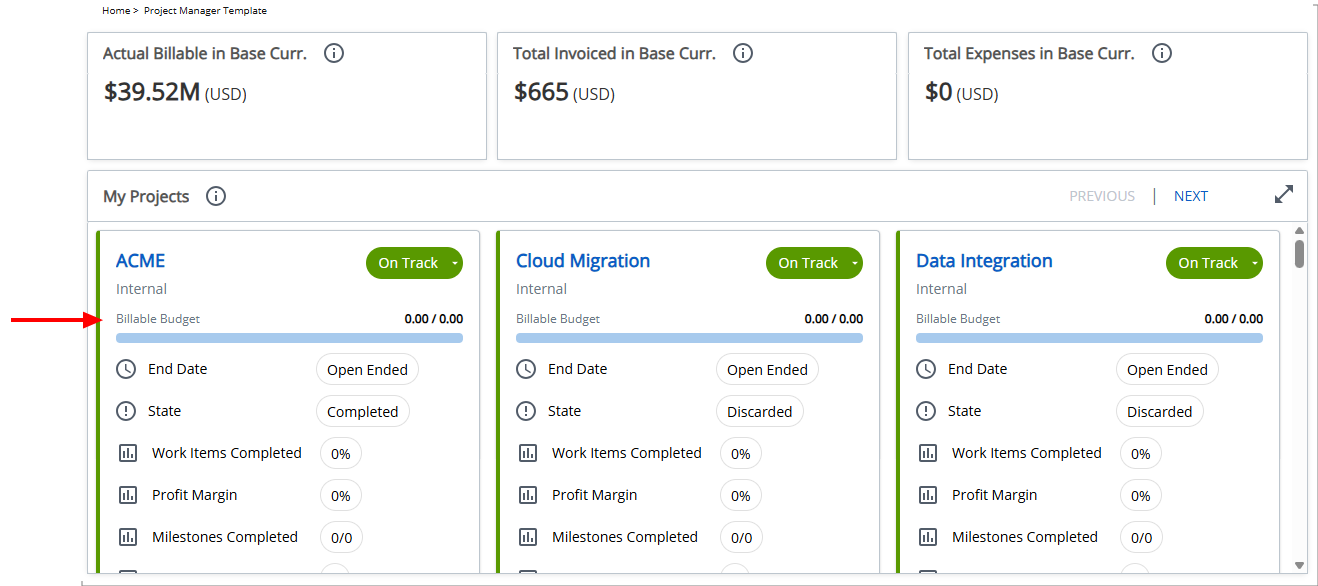
On the homepage, users will see a separate project tile for each project where they are assigned as the Project Manager. Each tile displays the budget metric configured in the My Projects widget—Cost Budget, Time Budget, Billable Budget, or Non-Billable Budget—and the data shown reflects the selected Time Range.
When users hover over the budget bar on any project tile, a tooltip appears showing the exact values used in the calculation. The tooltip displays the amounts as follows:
- Cost Budget – Actual Cost in Base Currency / Current Cost Budget in Base Currency
- Time Budget – Total Time / Current Time Budget
- Billable Budget – Actual Billable / Current Billable Budget
- Non-Billable Budget – Actual Non-Billable / Current Non-Billable Budget
This gives you quick, precise visibility into actuals and budgets—based on the selected time range—directly from your Homepage.
Benefit: These enhancements provide a more flexible and targeted view of project budgets directly on the Homepage.
Description: In previous releases, the My Projects widget displayed only a limited, fixed set of KPIs on each project card, with no ability for administrators to select additional KPIs or control their order. This restricted at-a-glance visibility into key project metrics and required users to navigate elsewhere for deeper insight.
With this release, the My Projects widget has been enhanced to support a broader set of project KPIs that can be configured and reordered by administrators. Up to five KPIs can now be selected per project card. Administrators can choose which KPIs are displayed and arrange their order using drag-and-drop directly within the widget configuration.
To configure:
- From the Homepage Designer layout area, click Configure My Projects Widget.
- Navigate to the KPI tab.
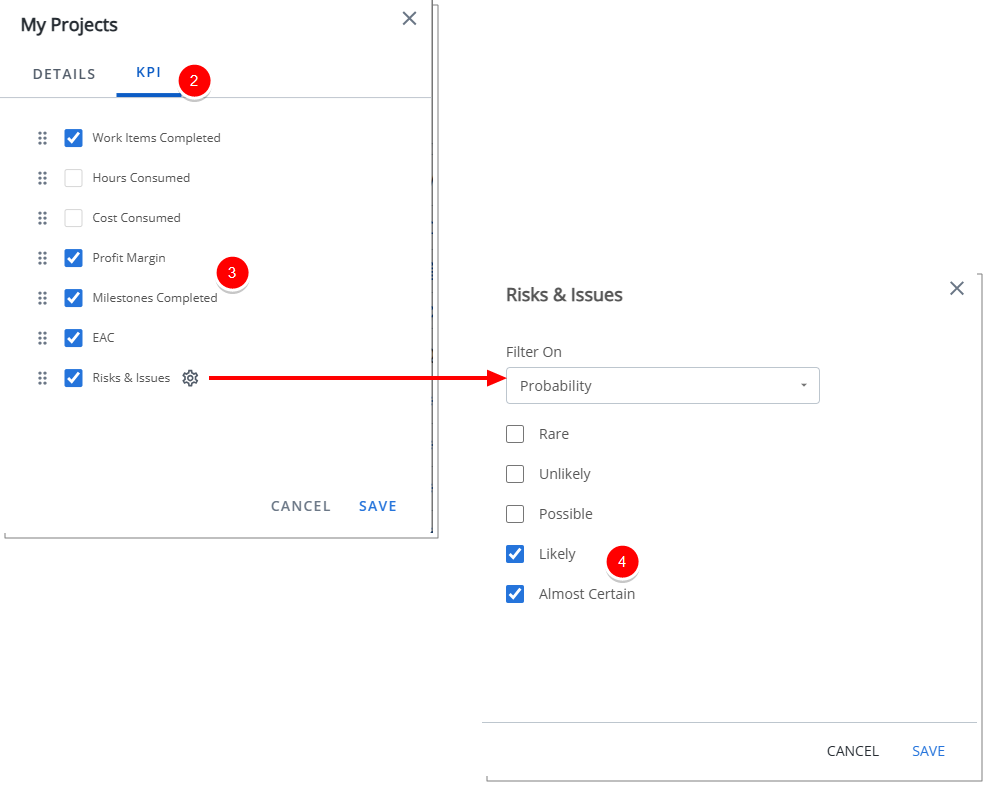
- Select the required KPI(s) from the available options:
- Work Items Completed - Shows the percentage of work items completed out of the total planned work items. Calculated as
(Completed Work Items/Total Work Items) x 100. - Hours Consumed - Shows actual hours consumed compared to the forecasted work plan hours up to the forecast cutoff date. Calculated as
(Actual Hours/Time Forecast, WP hours - Until FP template cutoff date) x 100. - Cost Consumed - Shows actual project cost compared to the forecasted project cost. Calculated as
(Actual Cost/Cost Forecast) x 100. - Profit Margin - Shows project profitability as a percentage of revenue after deducting total costs. Calculated as
[(Revenue-Cost)/Revenue] x 100. When the calculated value is negative, the Profit Margin is displayed in red to clearly indicate a loss. - Milestones Completed - Displays the number of completed billing and non-billing milestones relative to the total number of milestones, shown as a fraction. The value is calculated as
Completed Milestones / Total Milestones(for example, 2/6). - EAC - Shows the estimated total hours at completion. Calculated as
Actual hours + remaining Forecasted hours. - Risks & Issues - Displays the count of Risks and Issues on the project that require attention. When Risks & Issues is selected, click the Settings icon to configure the KPI filter. Choose the applicable filter type—such as Priority, Probability, or Severity—and then select the desired values:
- Priority: Low, Medium, High, Critical, and/or Blocker.
- Probability: Rare, Unlikely, Possible, Likely, and/or Almost Certain.
- Severity: Insignificant, Minor, Moderate, Major, and/or Catastrophic.
- Work Items Completed - Shows the percentage of work items completed out of the total planned work items. Calculated as
- To reorder KPIs:
- Hover over the drag handle (
 ) next to the KPI you want to move.
 - Click and hold the drag handle, then drag the KPI to the desired position in the list.
- Release the mouse button to drop the KPI in its new position.
- Hover over the drag handle (
- Click Save to apply your changes.
End-User Experience:
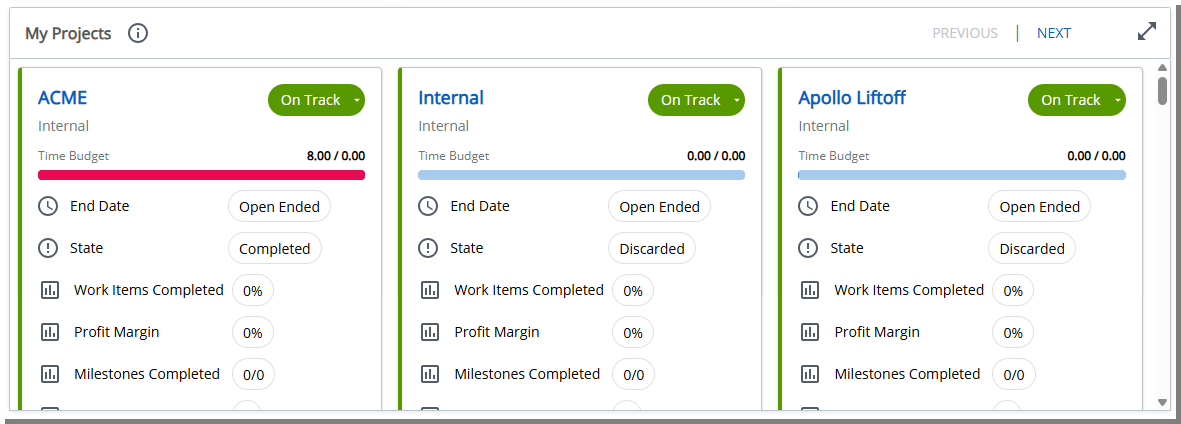
The Project card layout dynamically adapts to the selected KPIs, resizing vertically as needed to ensure all metrics are displayed clearly without breaking formatting or truncating content. All KPIs respect the project template and Financial Planner logic, ensuring calculations remain consistent with existing forecasting and budgeting behavior.
Benefit: These enhancements provide greater flexibility and visibility by allowing teams to surface the most relevant project metrics directly on the Homepage. Users can quickly assess project health at a glance, while administrators retain full control over which KPIs are shown and how they are presented.
For further details see My Projects Widget.
Description: In the previous release, the My Recent Items widget allowed users to quickly return to recently viewed Projects, Tasks, Work Items, and Users. When multiple instances of this widget were added to the Homepage, each configured to show different item types, the widgets did not behave independently. For example, a widget configured to show only recent Projects and another configured to show only recent Users would not reliably display their respective data. This prevented administrators and users from effectively using multiple My Recent Items widgets to monitor different types of work on the same Homepage.
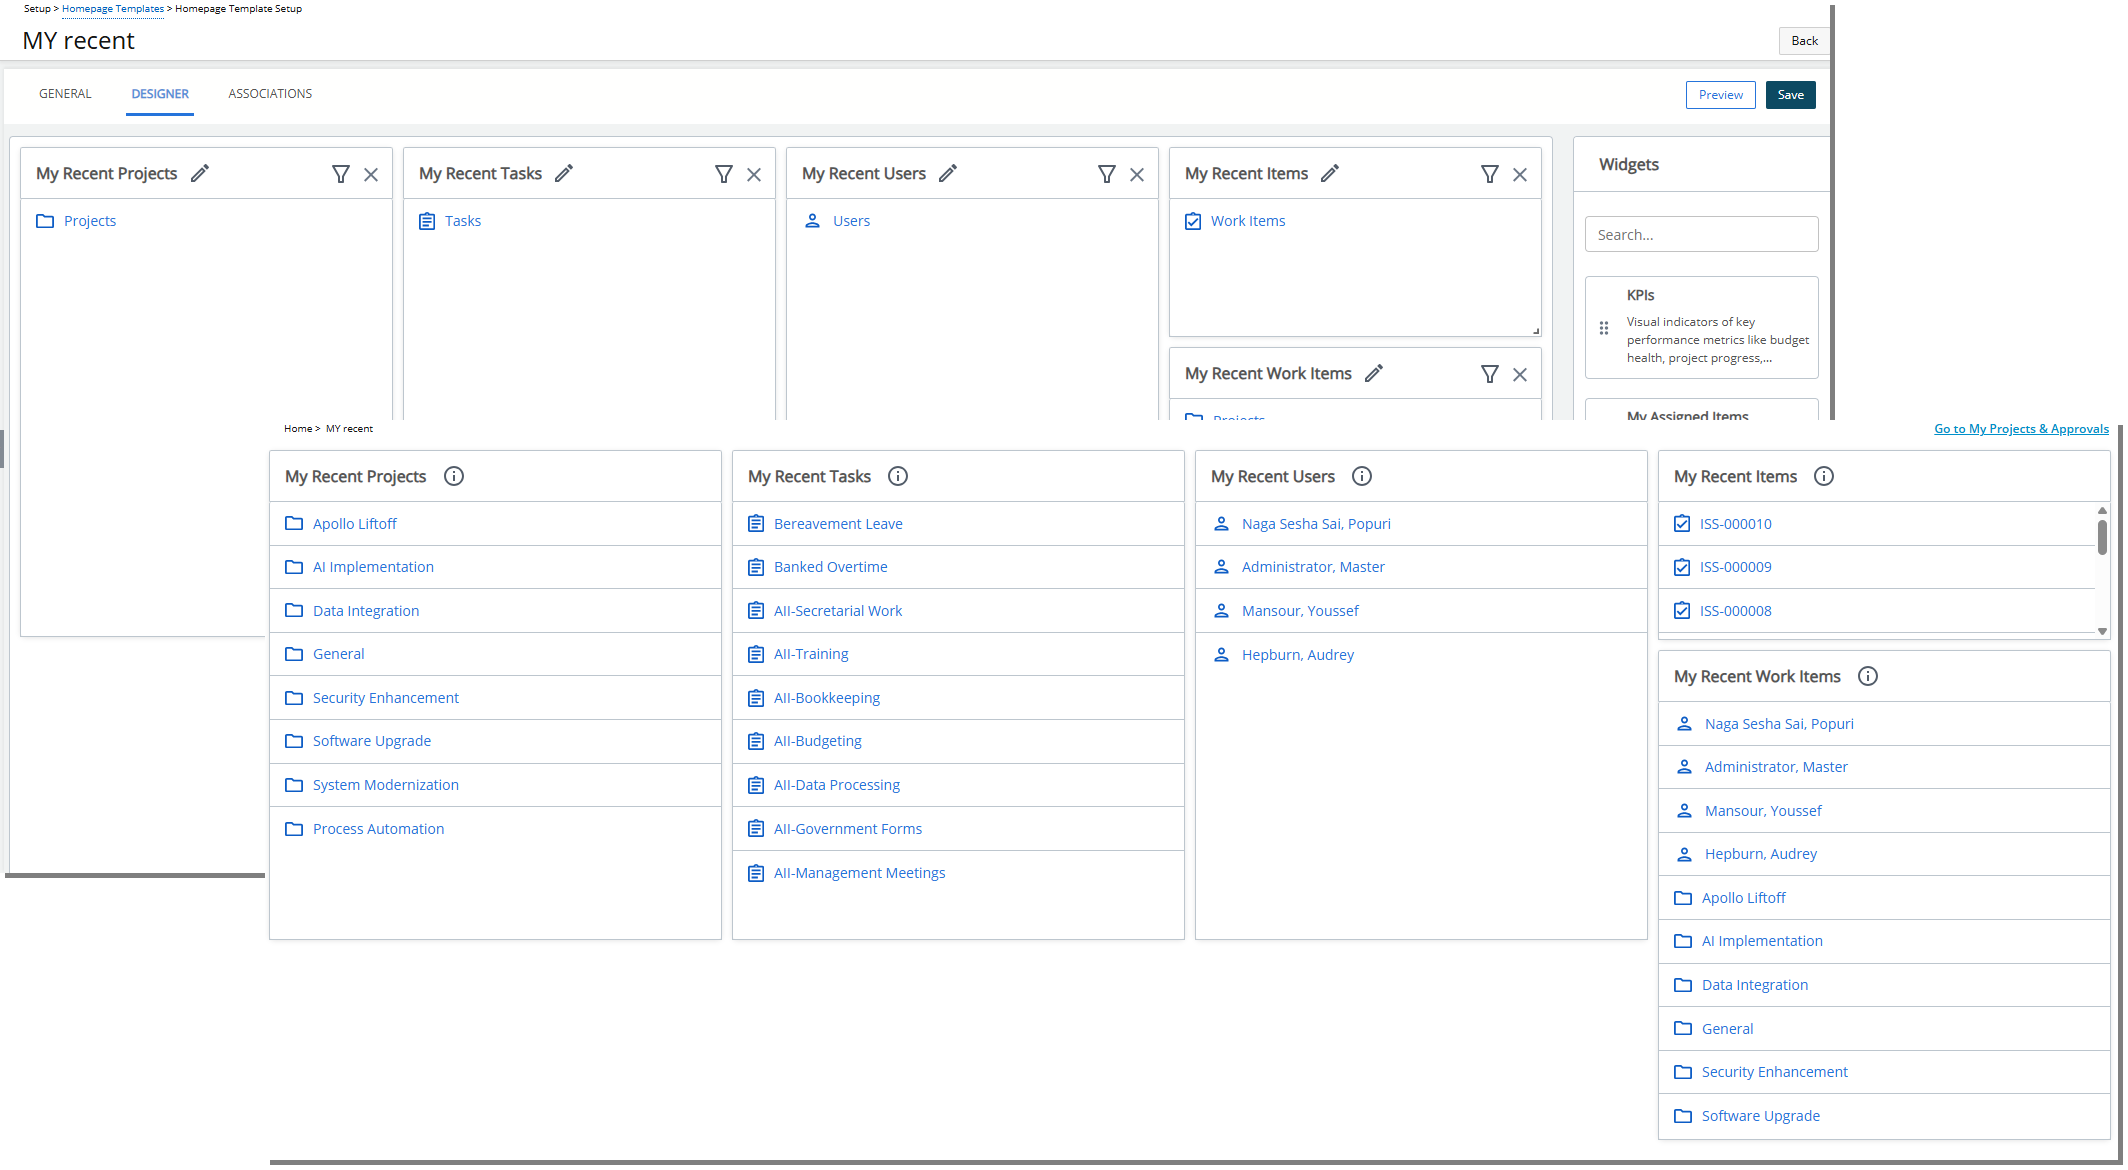
With this release, each instance of the My Recent Items widget now operates fully independently based on its own configuration. Administrators can add multiple widgets to a Homepage, each configured for Projects, Tasks, Work Items, or Users, and each widget will correctly display up to 10 of the most recently viewed items of its selected type.
If multiple types are selected in a single widget, it displays a combined list of up to 10 items sorted by recency. Tiles no longer conflict with each other, and each one reliably shows the correct data for its own filter settings.
Example Scenario
An administrator creates a Homepage Template and adds two separate My Recent Items widgets.
- The first widget is renamed My Recent Projects and configured to display Projects only.
- The second widget is renamed My Recent Tasks and configured to display Tasks only.
The template is then assigned to User A.
Later, User A works on several records—editing 8 projects and 9 tasks throughout the day. When User A logs in and views their Homepage:
- My Recent Projects correctly displays the 8 most recently updated projects based on the latest activity.
- My Recent Tasks correctly displays the 9 most recently updated tasks based on the latest activity.
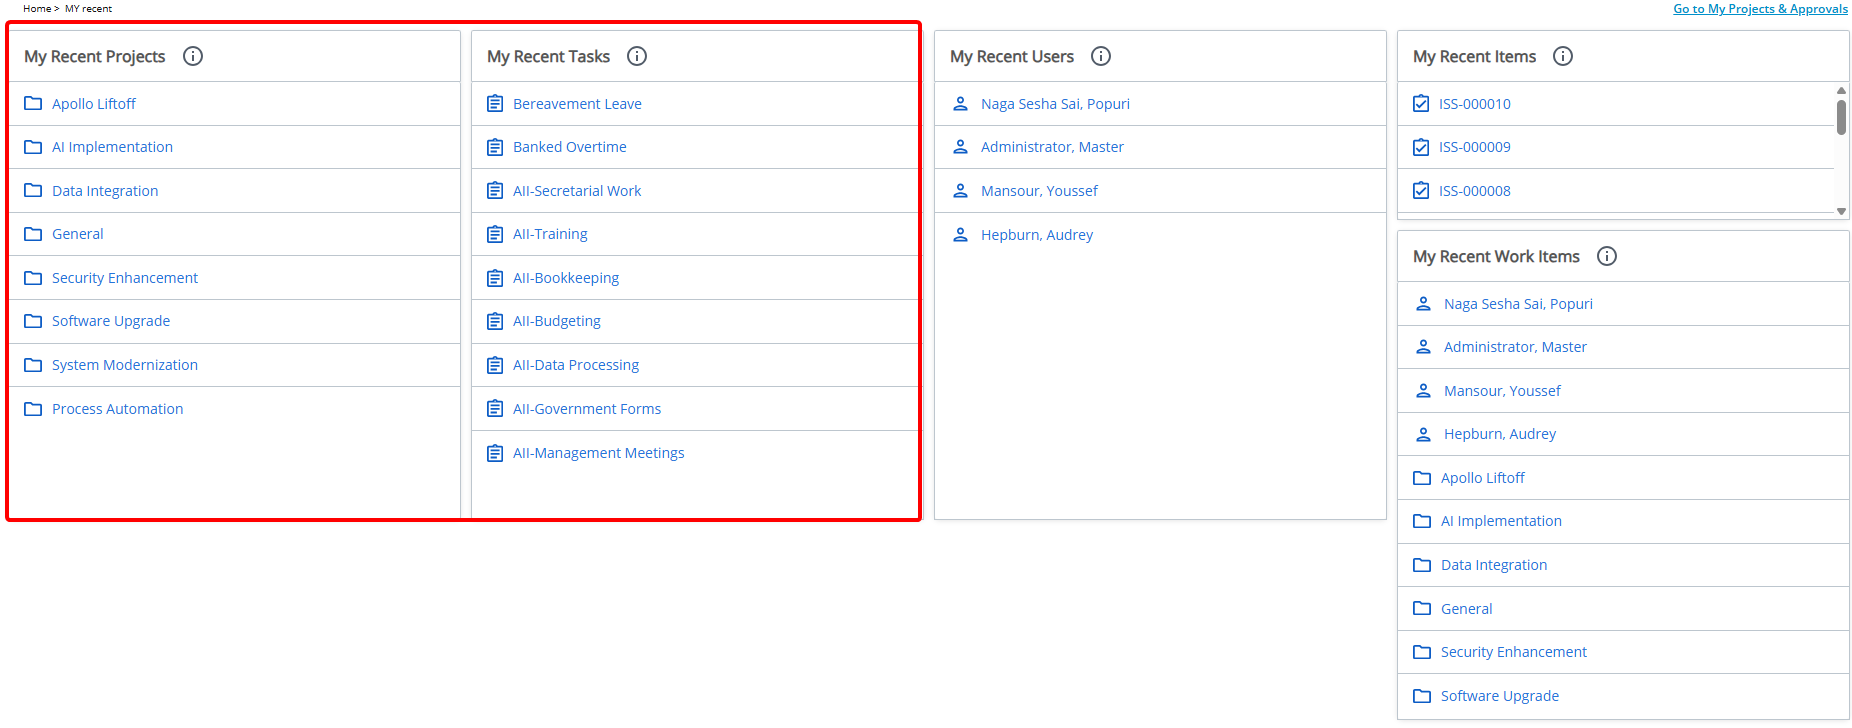
Each tile displays its own data independently, with no overlap or missing results. The limit of 10 items applies separately to each tile, ensuring the user can track different types of recent activity at a glance.
Benefit: This improvement ensures complete flexibility when designing Homepages. Each tile displays the correct icons, titles, and links, and provides clear empty-state messages when no recent items exist for the selected type. Users can now rely on multiple My Recent Items widgets to track different kinds of updates simultaneously, with accurate, predictable results every time.
For further details see My Recent Items Widget.
The My Work Widget has been enhanced with two key improvements to help users work more efficiently and focus on what matters most. First, a new Context-Aware Search streamlines navigation by filtering Projects, Tasks, or Timesheets in real time based on the active tab, making it faster to find specific items. Second, the Rejection Note Column provides immediate visibility into the reason a Timesheet was rejected, reducing extra clicks and enabling quicker corrections.
Click a title below to explore each improvement in detail.
Description: In the previous release, the My Work widget did not include a search capability, which made it difficult for users—especially those managing large numbers of projects, tasks, and timesheets—to quickly locate specific items. Users often had to scroll through long lists or switch tabs repeatedly to find what they needed.
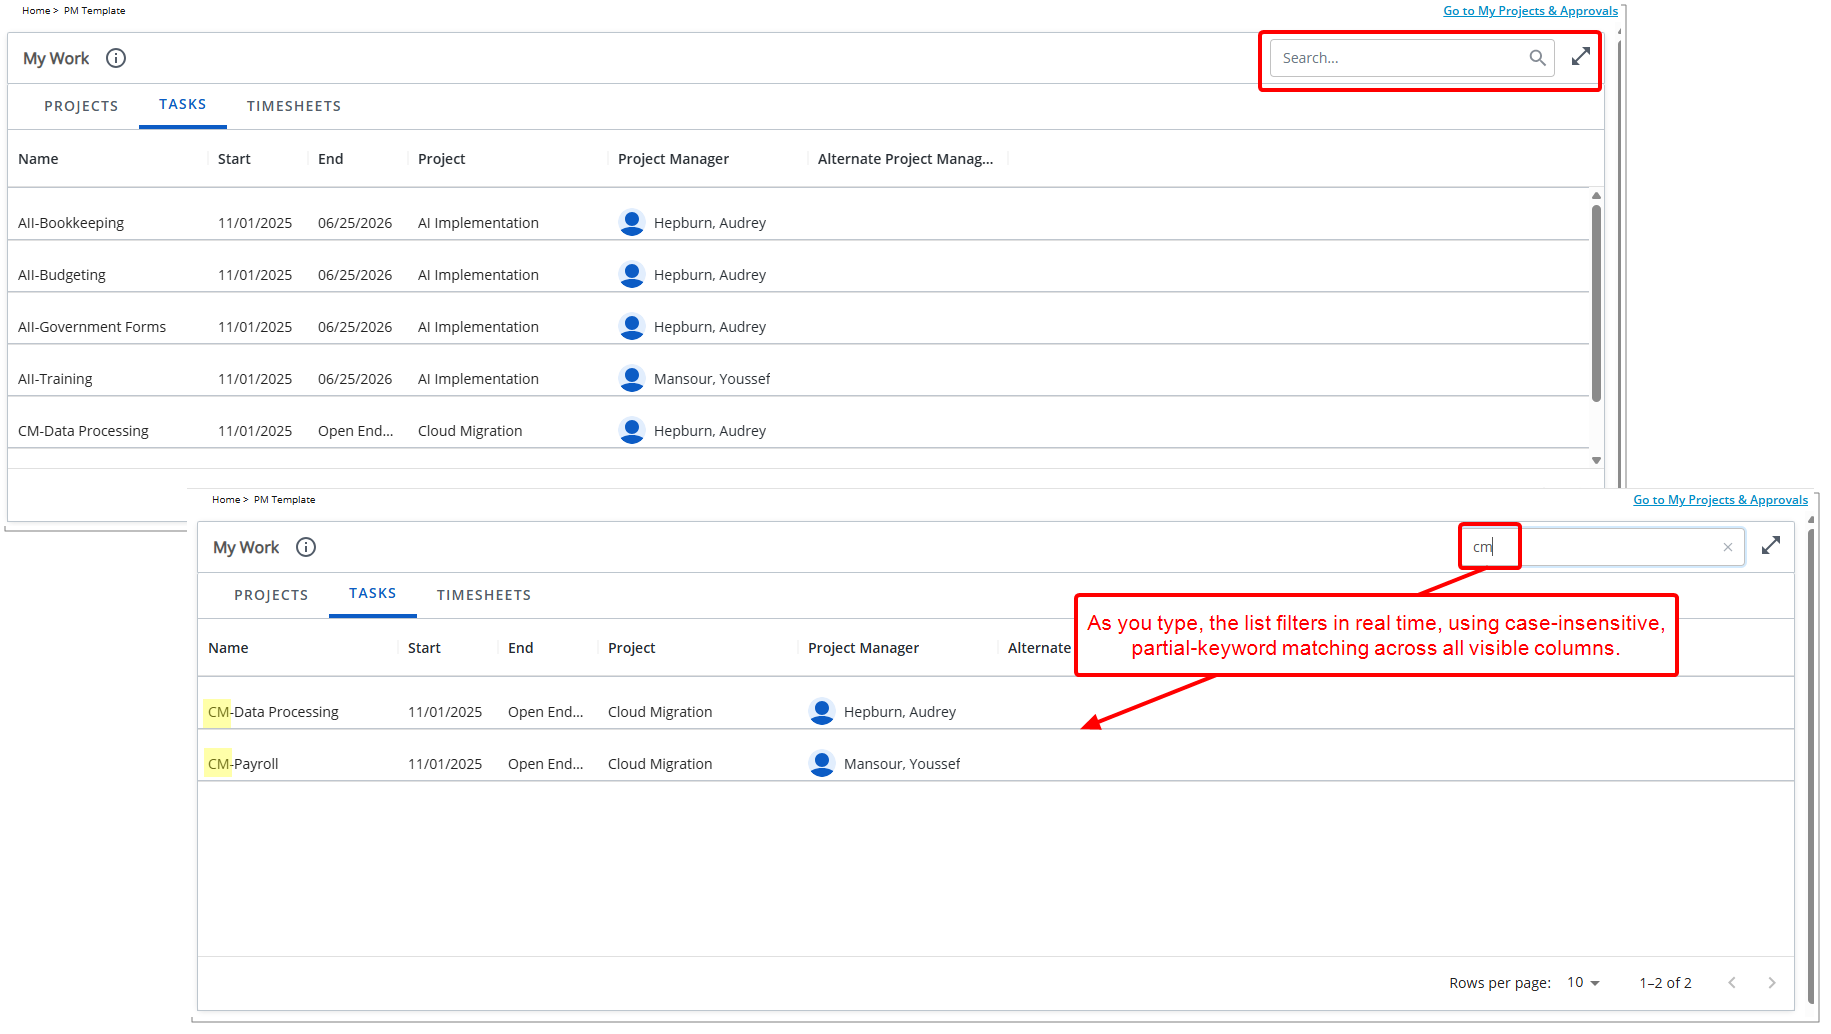
In this release, we have introduced a context-aware search bar that streamlines navigation and improves productivity. The new search option appears at the top of the My Work tile and remains visible regardless of the active tab.
When you select Projects, Tasks, or Timesheets, the search automatically applies only to the items within that tab, ensuring that results are relevant and never mixed across categories.
As you type, the list filters in real time, using case-insensitive, partial-keyword matching across all visible columns. A clear (x) button allows you to reset the list instantly, and a friendly empty-state message appears if no items match the search criteria.
Benefit: This enhancement provides a faster, more intuitive experience and helps users focus on the work that matters without unnecessary scrolling or switching.
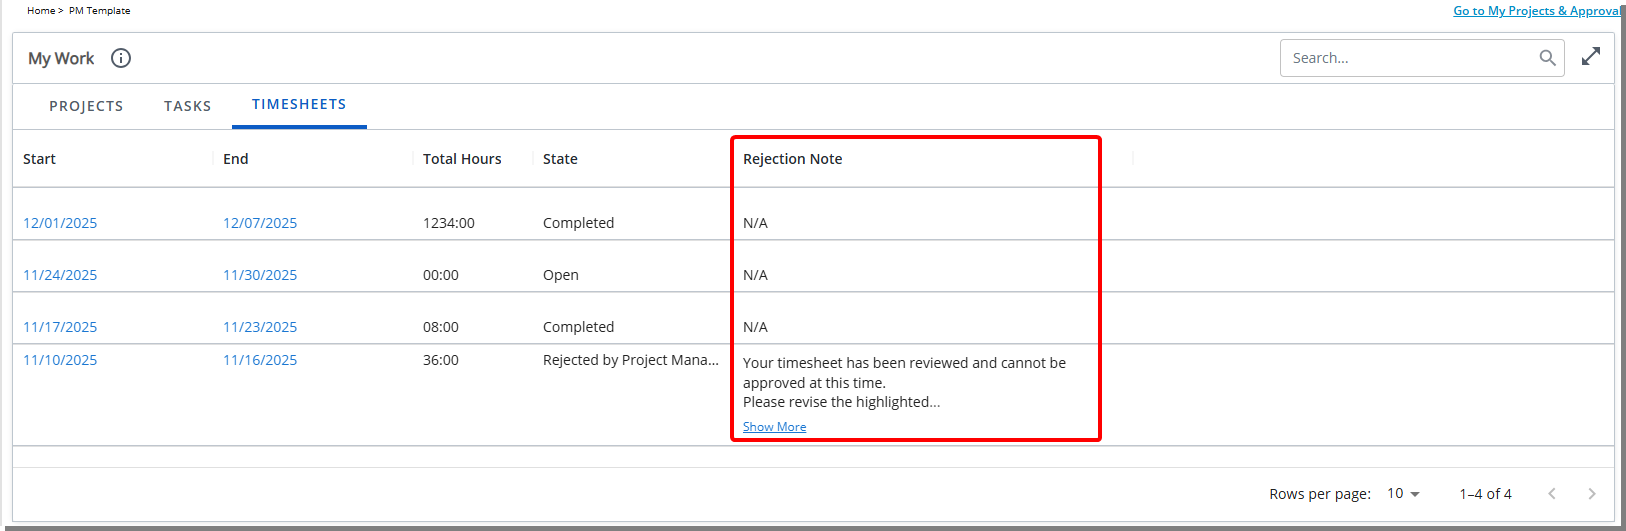
Description: In previous releases, users had no visibility into why a Timesheet was rejected unless they opened the record and navigated to its details. This created extra clicks, slowed down corrections, and made it difficult to understand what needed to be fixed directly from the Homepage.
With this release, a new Rejection Note column has been added to the Timesheets tab of the My Work widget. This enhancement allows you to see the most recent rejection reason at a glance, helping you quickly identify issues and take action.
The Rejection Note column displays the latest rejection message associated with each Timesheet, up to 100 characters. Longer notes are automatically truncated and end with an ellipsis (“…”). A Show more link expands the row and reveals the full rejection message, ensuring clarity while keeping the table clean and readable.
If a Timesheet has never been rejected—or is currently in Submitted State—the column will display “N/A”.
Note: All existing Homepages that include the My Work tile will automatically be updated. The Rejection Note column wil be displayed without requiring any additional configuration.
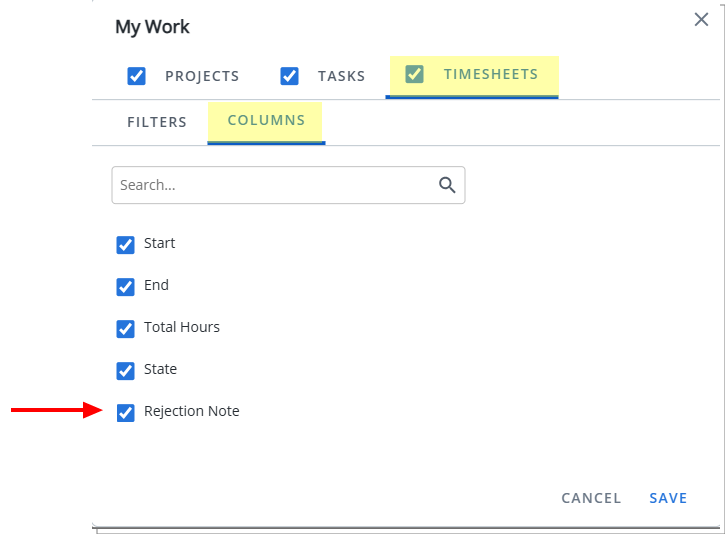
The visibility of this column can be managed through the My Work Widget configuration:
- From the Homepage Designer layout area, click Configure My Work Widget.
- Navigate to the Timesheets tab and open the Columns sub-tab.
- Here, you will see the newly added Rejection Note checkmark, which is selected by default.
Benefit: This update significantly improves efficiency by reducing unnecessary navigation and giving users immediate insight into what needs to be corrected.
For further details see My Work Widget.
The KPIs Widget has been enhanced with three key improvements designed to provide greater flexibility, clarity, and insight at a glance. First, it now supports User-based KPIs, enabling administrators to track individual and team performance metrics alongside traditional project KPIs. Second, Project User Defined Fields (UDFs) and Advanced UDFs can be displayed directly in the widget, allowing for real-time visibility of custom, project-specific metrics on home pages. Finally, a new short-format number option (K/M/B) improves readability for high-volume metrics, presenting values in a concise, dashboard-friendly format without losing accuracy. Together, these updates make the KPIs Widget more personalized, informative, and actionable for all users.
Click a title below to explore each improvement in detail.
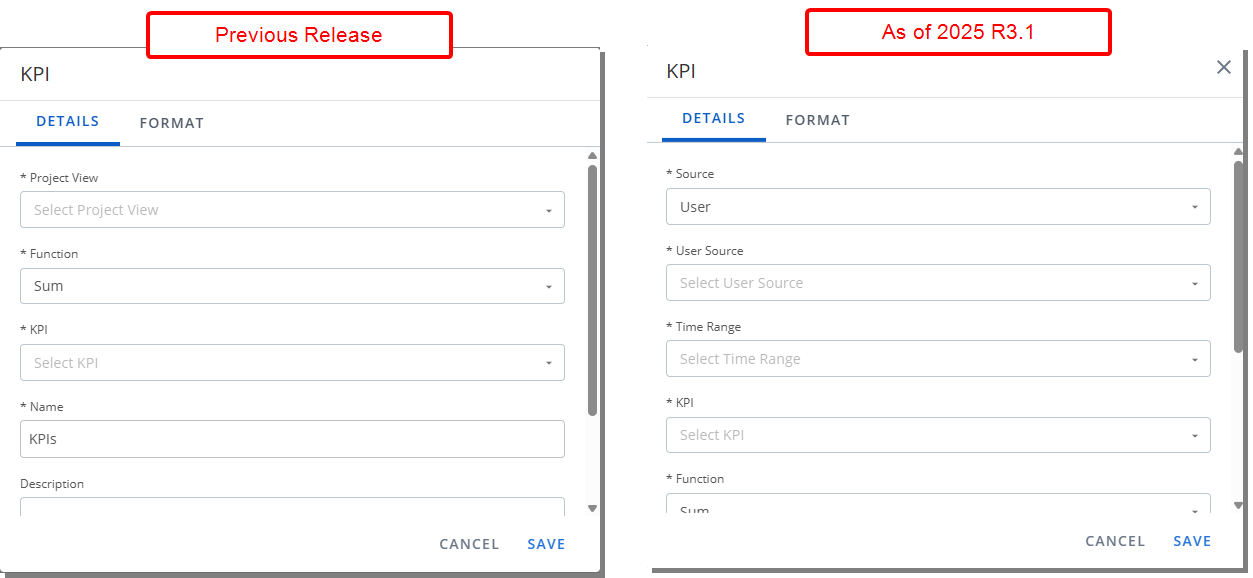
Description: In previous releases, the KPIs Widget supported only Project-based metrics, allowing administrators to display performance indicators sourced exclusively from Project Views. All KPI selections—such as budget, hours, and progress—were calculated using project data.
With this release, the KPIs Widget has been enhanced to include User-based metrics, enabling organizations to surface KPIs derived from Project Team Member data. This expansion makes it possible to monitor resource-level performance indicators such as billable hours, booked capacity, utilization, and assigned tasks alongside traditional Project KPIs.
To preserve compatibility with existing homepage configurations, the widget now includes a new Source selector:
- Project is selected by default, ensuring that all current KPI widgets continue functioning exactly as they did before.
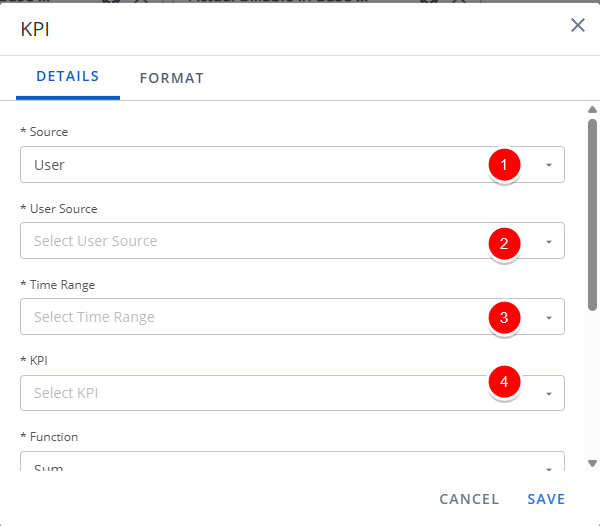
- When User is selected, the configuration fields dynamically update to reflect the new data source:
- User Source - Specify which users are included when calculating and displaying User-based KPIs. Select an option to define the scope of users based on the logged-in user’s role, reporting relationships, or organizational structure. Available options are:
- Logged User
- All Users
- Everyone who reports to me as a (Functional) Manager
- Everyone who reports to me as a (Approval)
- Everyone who reports to me as a (Resource)
- My Direct Reports (Functional)
- My Direct Reports (Approval)
- My Direct Reports (Resource)
- Time Range - Defines the reporting period used to calculate User-based KPIs. The selected time range determines which metrics are included in KPI calculations, based on the applicable date logic for each KPI. Available options are: Current Week, Current Month, Current Quarter, Current Year, Next Week, Next Month, Next Quarter, Next Year, Last Week, Last Quarter, Last Year or YTD - Year to Date.
- KPI - Displays User-related KPIs such as:
KPI Name Description Formula Notes Billable Utilization % Indicates the percentage of working hours spent specifically on billable work. (Timesheet Billable Hours + Forecast Billable Hours) / Total Working Hours • Uses Financial Planner status dates to distinguish actual vs. planned hours.
• Total Working Hours are based on calendar hours.Open Timesheets (Count) Shows the total number of timesheets that are open or partially rejected for the current period. Count of applicable timesheets • Includes Timesheets in the current period that are not submitted or have partial rejection. Overdue Tasks (Assignments) (Count) Indicates the number of tasks past their due date that remain incomplete. Count of overdue incomplete assignments • End date has passed.
• Assignment is not marked complete .Target Utilization % Displays the expected or planned utilization goal for a user or their group. No formula (value pulled from User or Group Target Utilization) Priority order:
1. Valid for the end date.
2. User-level target.
3. Group-level target.
4. If none exist then default = 0.
Additional rules:
• Uses current functional group.
• Date logic: Current = today; Past/Future based on period end dates.Utilization (Overall) % Measures the percentage of total working hours spent on all logged and forecasted activities. (Total Timesheet Hours + Forecast Hours) / Total Working Hours Timesheet Hours:
• Includes all timesheet entries (any state).
• Excludes non-working time.
• Includes Overtime, Double Overtime, Adjustments.
• Follows system default logic.
Forecast Hours:
• Includes Work Plan (Soft + Hard bookings).
• Uses Financial Planner status dates.
• Uses UA views and default templates.
Total Working Hours:
• Based on calendar hours regardless of availability .
Note: All other configuration fields and available options—such as Time Range, Function, Name, and Description—remain unchanged. These settings continue to operate exactly as before and will apply to the KPI according to the selected Source (whether Project or User).
- User Source - Specify which users are included when calculating and displaying User-based KPIs. Select an option to define the scope of users based on the logged-in user’s role, reporting relationships, or organizational structure. Available options are:
- Name - Defaults to the selected KPI. You can modify it as needed.
- Description - Defaults to the system-defined Description of the KPI. You can modify it as needed to provide additional context or clarification.
Benefit: This enhancement brings more depth, personalization, and operational visibility to the KPIs Widget. Administrators can continue using familiar project-based KPIs while gaining new flexibility to incorporate resource-focused insights. End users benefit from immediate access to the metrics that matter most to their role—whether project outcomes, personal performance, or team-wide resource health.
Description: In the previous release, the KPIs Widget on Home Page Templates could only display standard, built-in KPIs. This limitation made it difficult for teams to track project-specific metrics directly on the homepage, requiring additional reports or dashboards for custom metrics.
As of this release, the KPI Widget now supports Project User Defined Fields (UDFs) and Advanced User Defined Fields, enabling administrators to display a wider range of project-specific metrics directly within Home Pages. Teams can now monitor key performance indicators at a glance, with consistent formatting and seamless integration alongside existing KPIs. Project-related KPIs include numeric, integer, currency, and percentage fields.
Benefit: This improvement extends the KPI Widget to include Project User Defined Fields (UDFs) and Advanced User Defined Fields, providing real-time, project-specific metrics within the Home Page while maintaining consistent formatting and visual consistency for seamless monitoring and reporting.
Description: In previous releases, KPI values were always shown in full numeric form. While accurate, this formatting made large numbers harder to quickly read and interpret—particularly for dashboards that surface high-volume metrics such as revenue, hours, or record counts in the thousands, millions, or higher. Without a short-format option, users often needed to pause and visually parse long numbers, reducing the at-a-glance value of the KPI tiles.
To improve readability and provide a more modern, dashboard-friendly experience, this release introduces a new short-format number option (K, M, B) in the KPI widget configuration.
Administrators can now enable a Use K/M/B format setting from the Format tab within the widget configuration. When selected, KPI values automatically convert to concise units such as 1K, 1.23M, or 1.31B, following Upland’s UI standards for rounding and decimal placement.
Note: When the Display numbers in K/M/B format checkbox is selected, the Include Decimal Values checkbox is automatically checked and grayed out.
For clarity, an information tooltip explains that decimal values are automatically applied for numbers over 1,000, and the Include Decimal Points option becomes pre-selected and disabled to ensure consistent behavior.
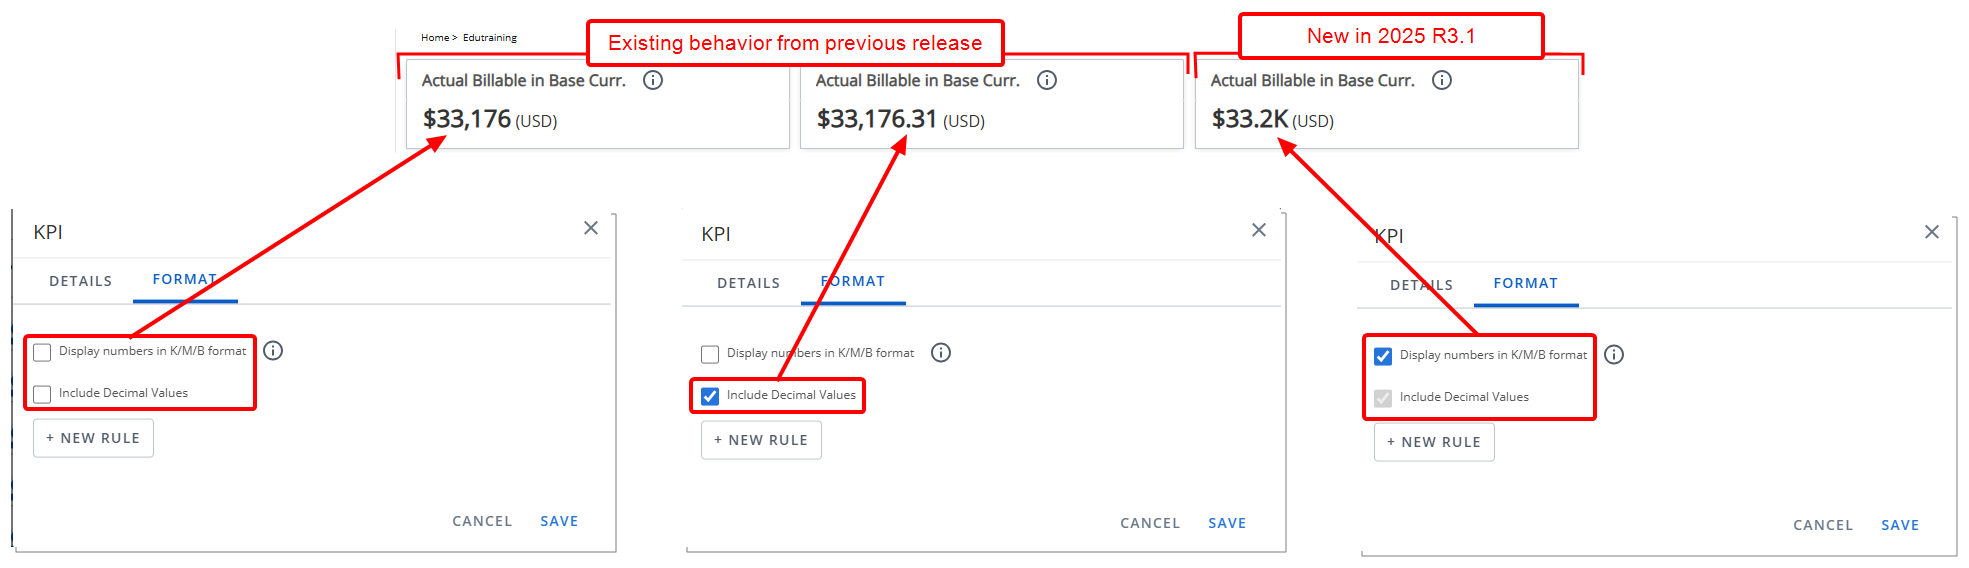
Scenario
An Admin is configuring the Actual Billable in Base Curr. KPI on the Homepage Template. The underlying KPI value in our example is $33,176.31 (USD).
Example 1: KPI Displays $33,176 (USD)
- Display numbers in K/M/B format → Unchecked
- Include Decimal Values → Unchecked
Full number format is used. Decimals are removed and the value is rounded to the nearest whole dollar.
Note: This reflects existing behavior from previous release.
Example 2: KPI Displays $33,176.31 (USD)
- Display numbers in K/M/B format → Unchecked
- Include Decimal Values → Checked
Because K/M/B format is not enabled, the KPI uses standard numbering. Since Include Decimal Values is checked, the widget shows the full number including decimals, exactly as provided. No rounding or short format is applied.
Note: This reflects existing behavior from previous release.
Example 3: KPI Displays $33.2K (USD)
- Display numbers in K/M/B format → Checked
- Include Decimal Values becomes auto-selected and disabled
K format applies (value is between 1,000 and 999,999). One decimal is required by K/M/B rules. Rounds to the nearest tenth.
Benefit: With this enhancement, administrators can deliver cleaner, more readable dashboards, allowing end users to quickly interpret trends and insights at a glance—without navigating through long or complex numbers.
For further details see KPIs Widget.
Integrations
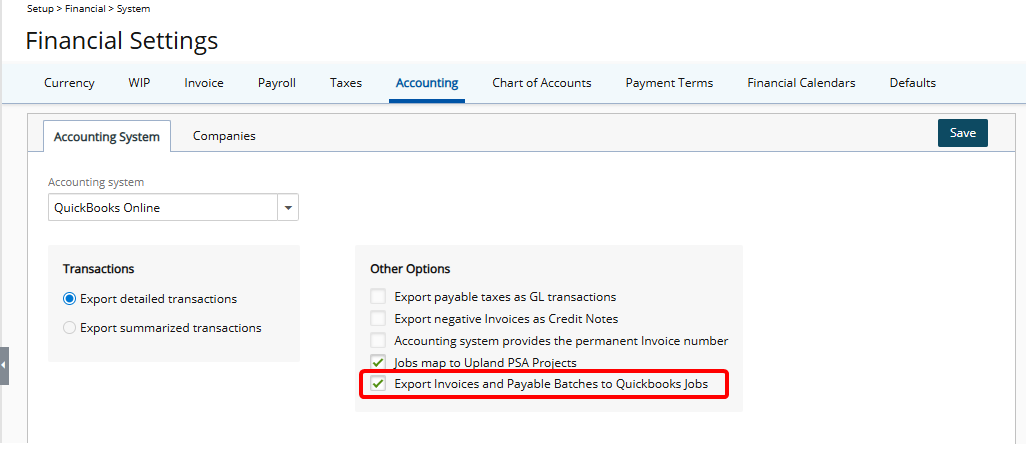
Description: Previously, if a Customer in QuickBooks Online had Jobs, there was no way to map exports directly to those sub-items. The export process always used the single integration identifier available for the main Customer, which meant Invoices and Payable Batches were always assigned at the main Customer level, even when you needed them to be linked to a specific Job.
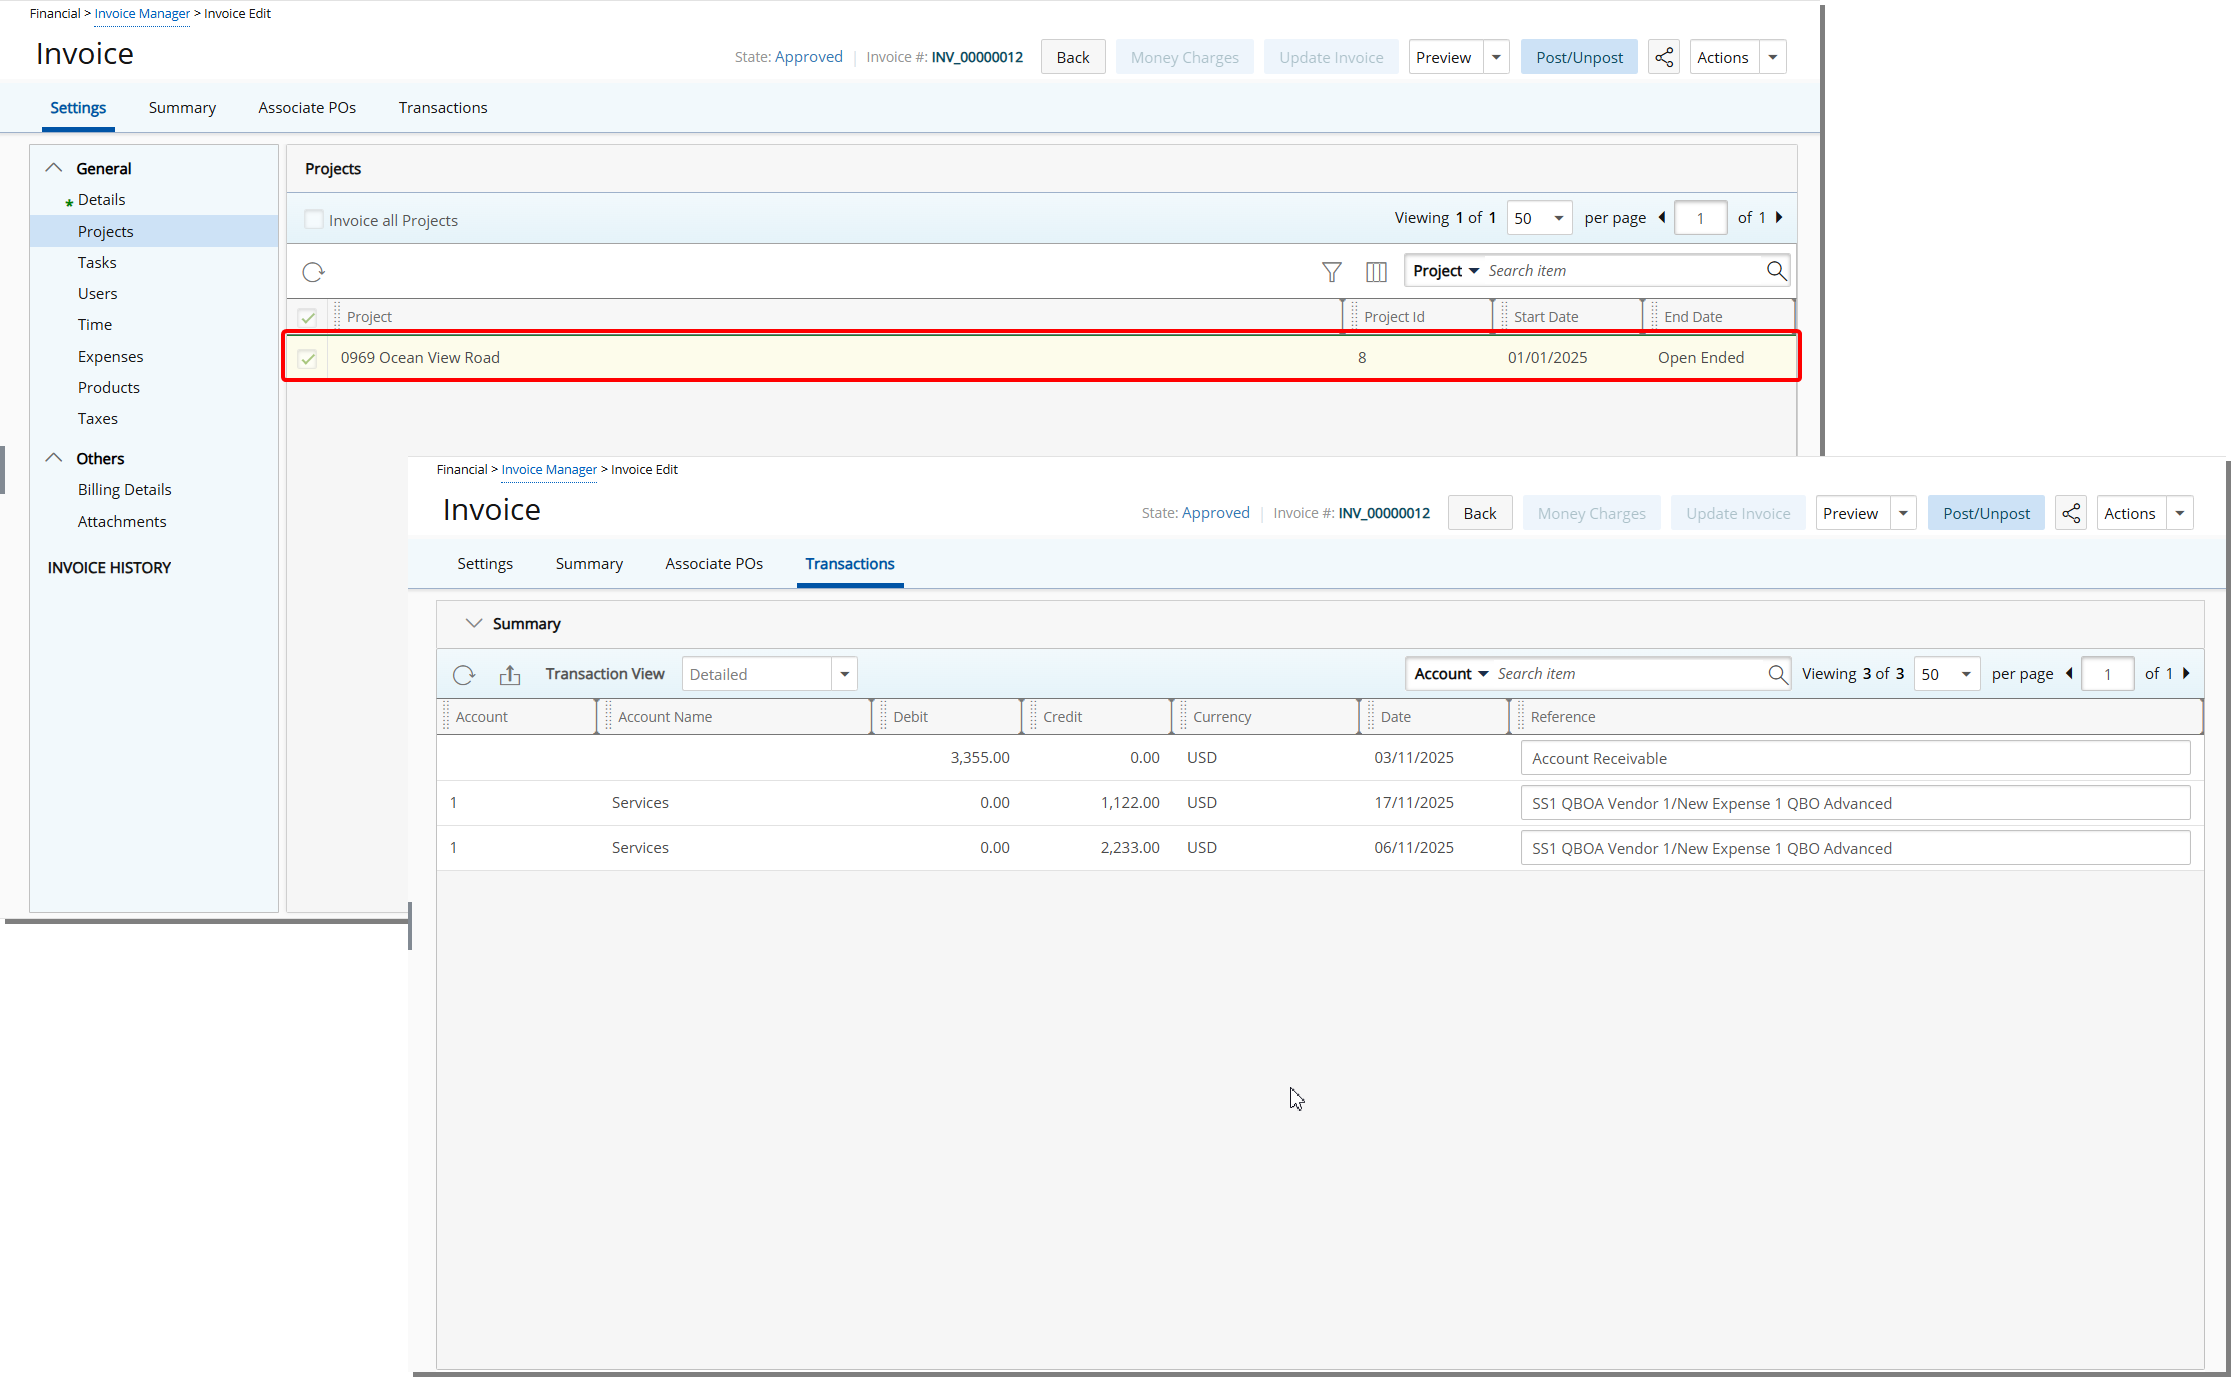
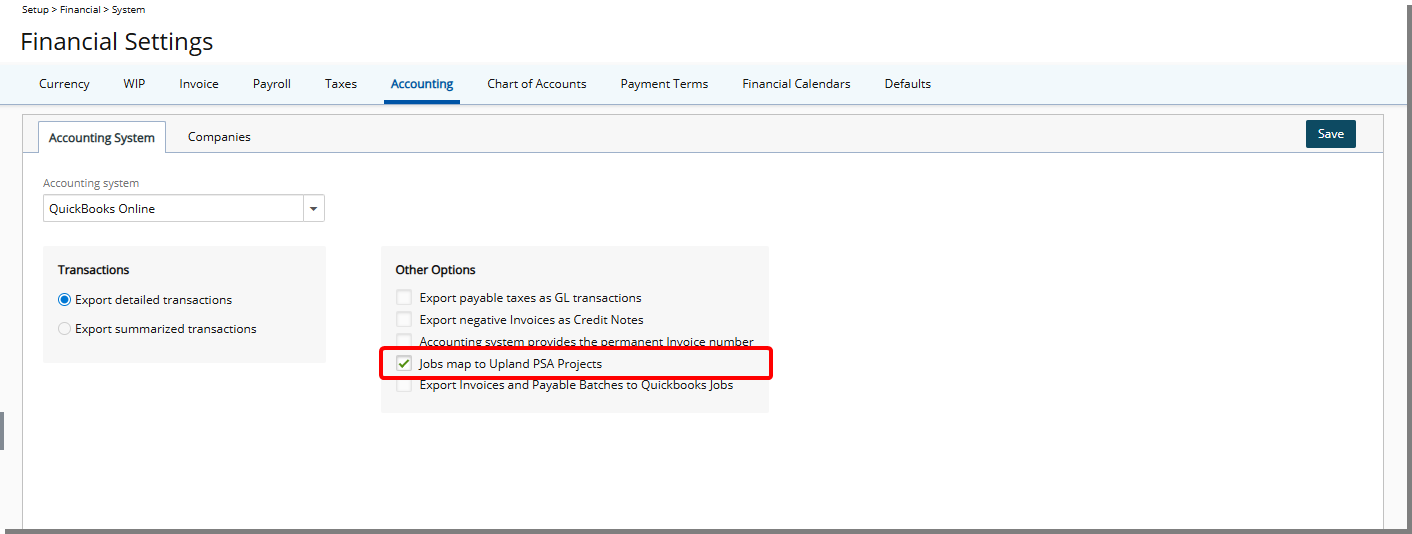
This release introduces a new Export Invoices and Payable Batches to QuickBooks Jobs located under the Accounting System subtab (Setup > Financial > System > Accounting) that allows you to specify whether Invoices and Payable batches should be exported to Jobs.
- With this option enabled, Payable Batch exports will map directly to the selected Job instead of the main customer.
- Invoice exports will also assign the invoice to the Job when the checkbox is selected.
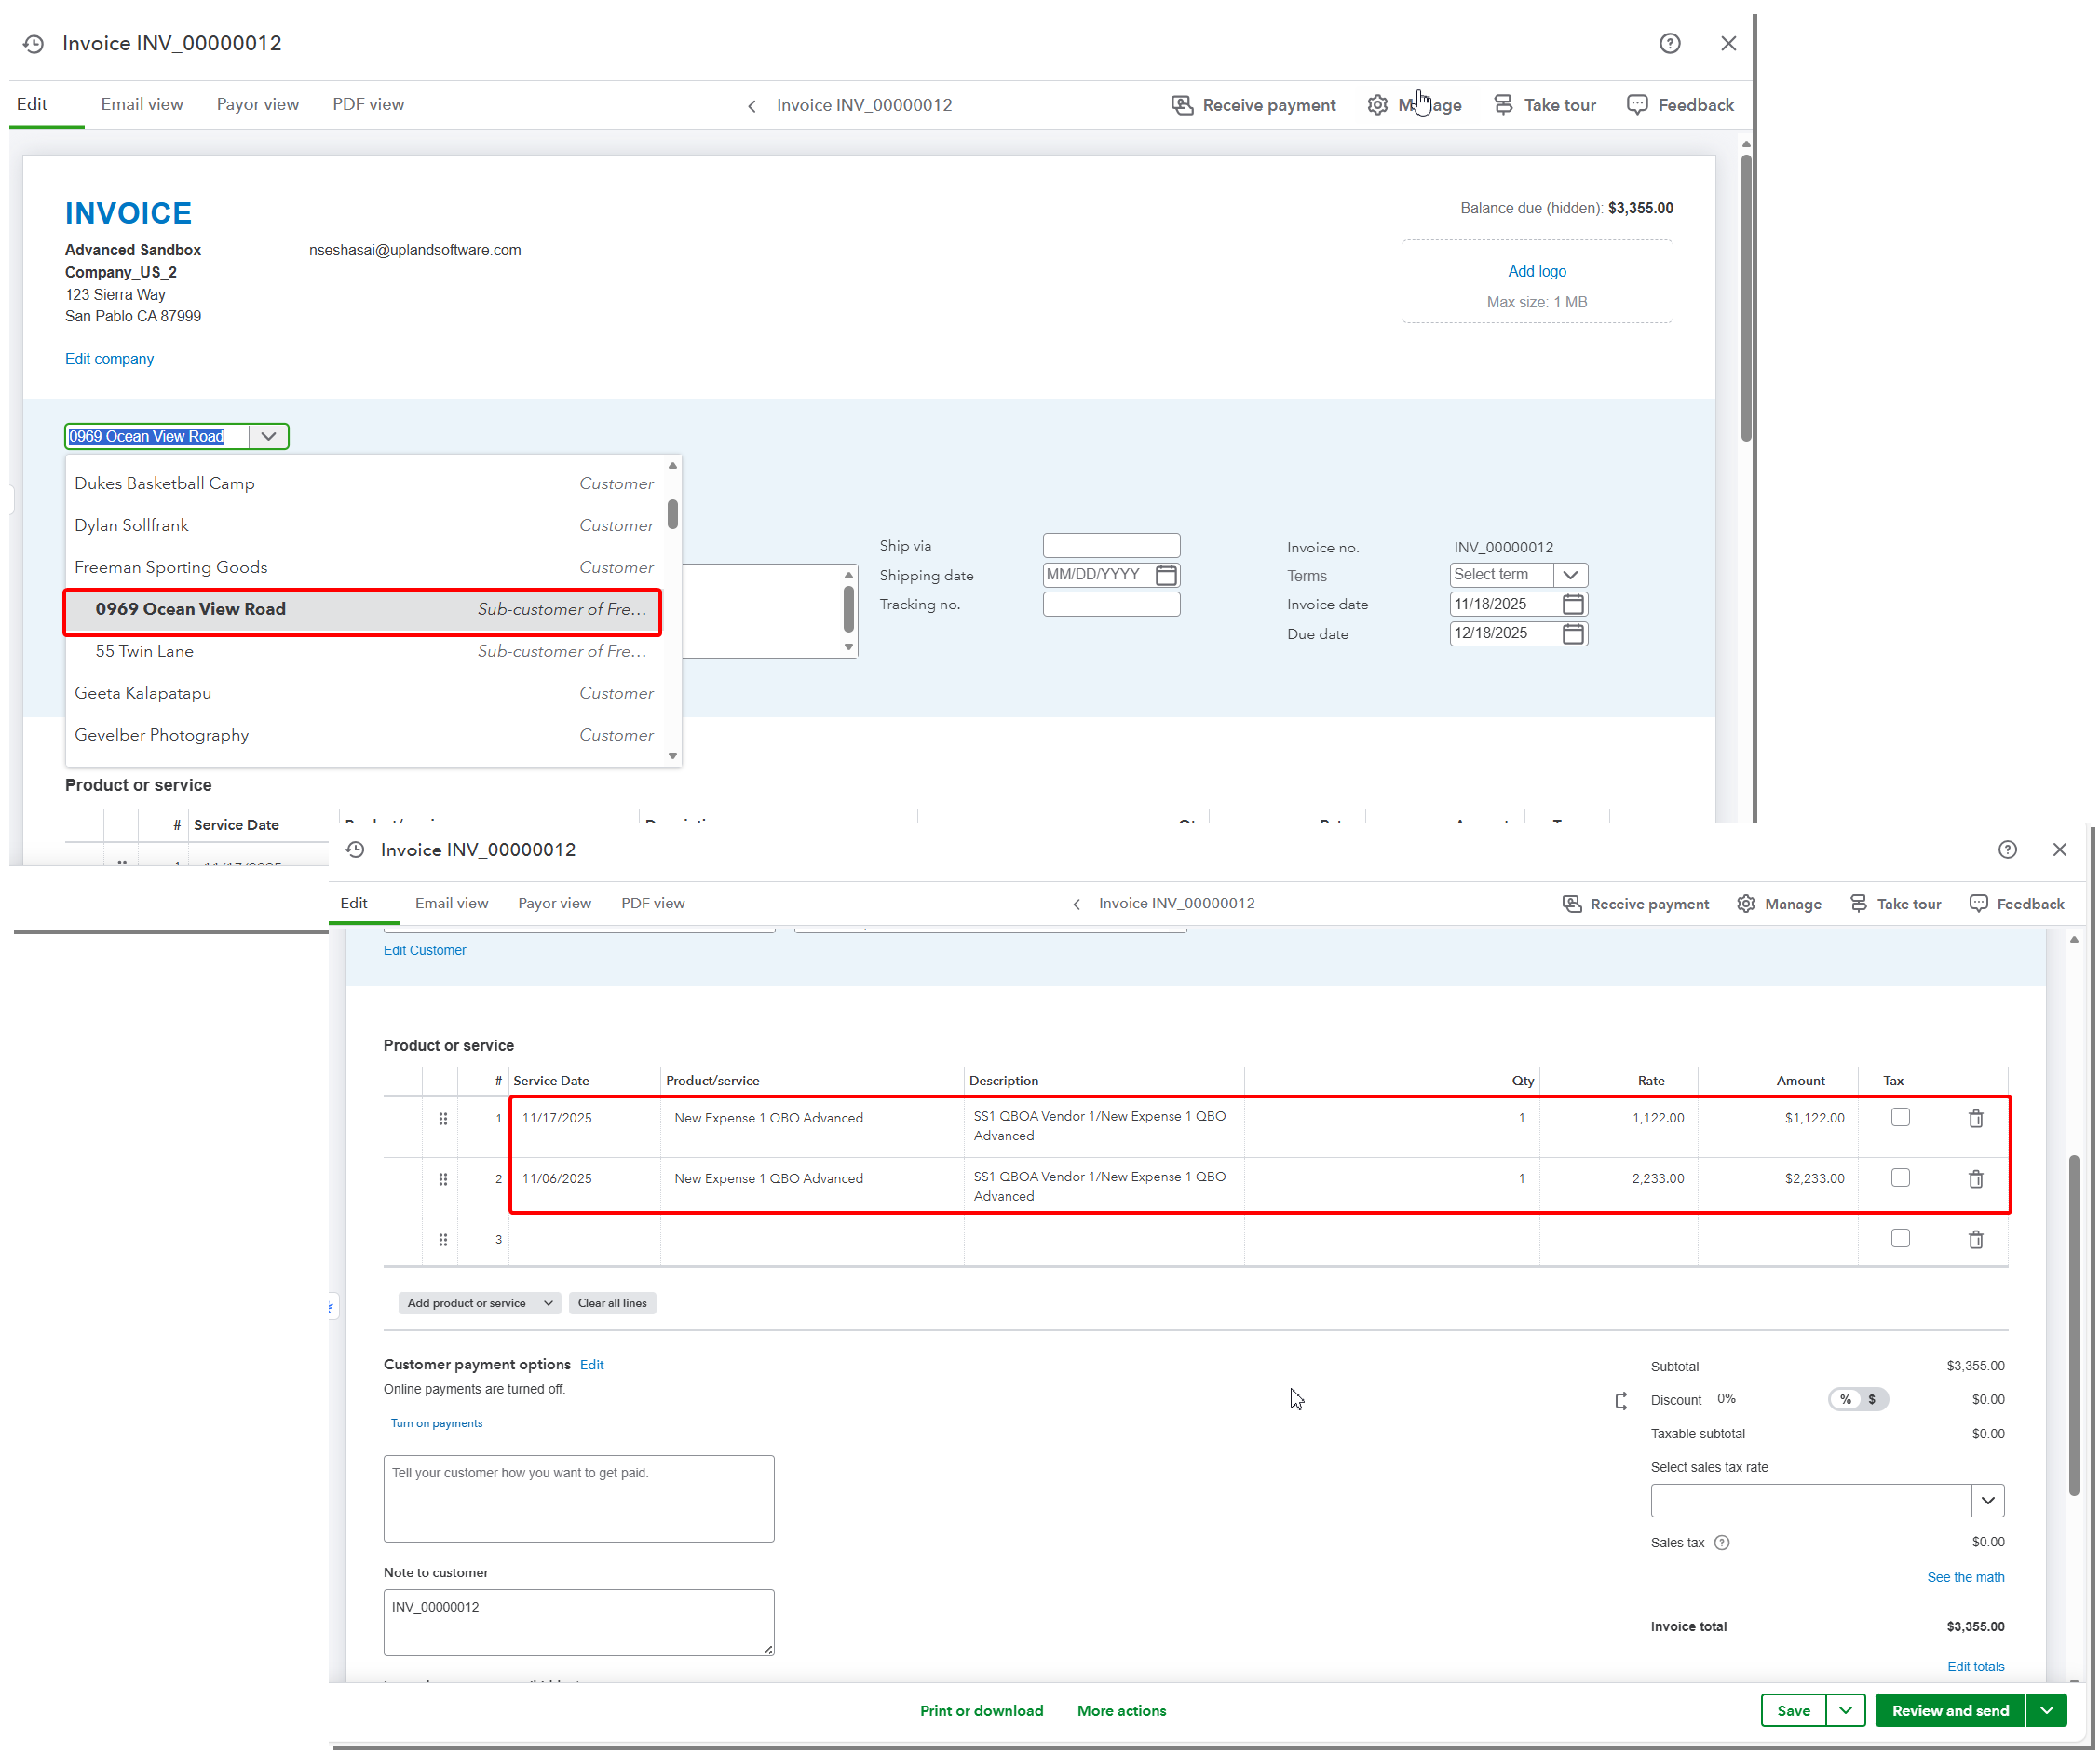
Note: When a Project included in an Invoice or Payable Batch does not exist in QuickBooks Online, the Invoices or Payable Batches continue to export under the associated Client, even when Export Invoices and Payable Batches to QuickBooks Jobs is selected. This behavior is consistent with the current design.
Benefit: This enhancement gives you direct control over how your financial data is mapped in QuickBooks Online. By allowing exports to be sent directly to the appropriate job, your invoices and payable batches reflect the correct structure in QuickBooks Online and maintain more accurate reporting.
For further details see PSA - QuickBooks Online Integration
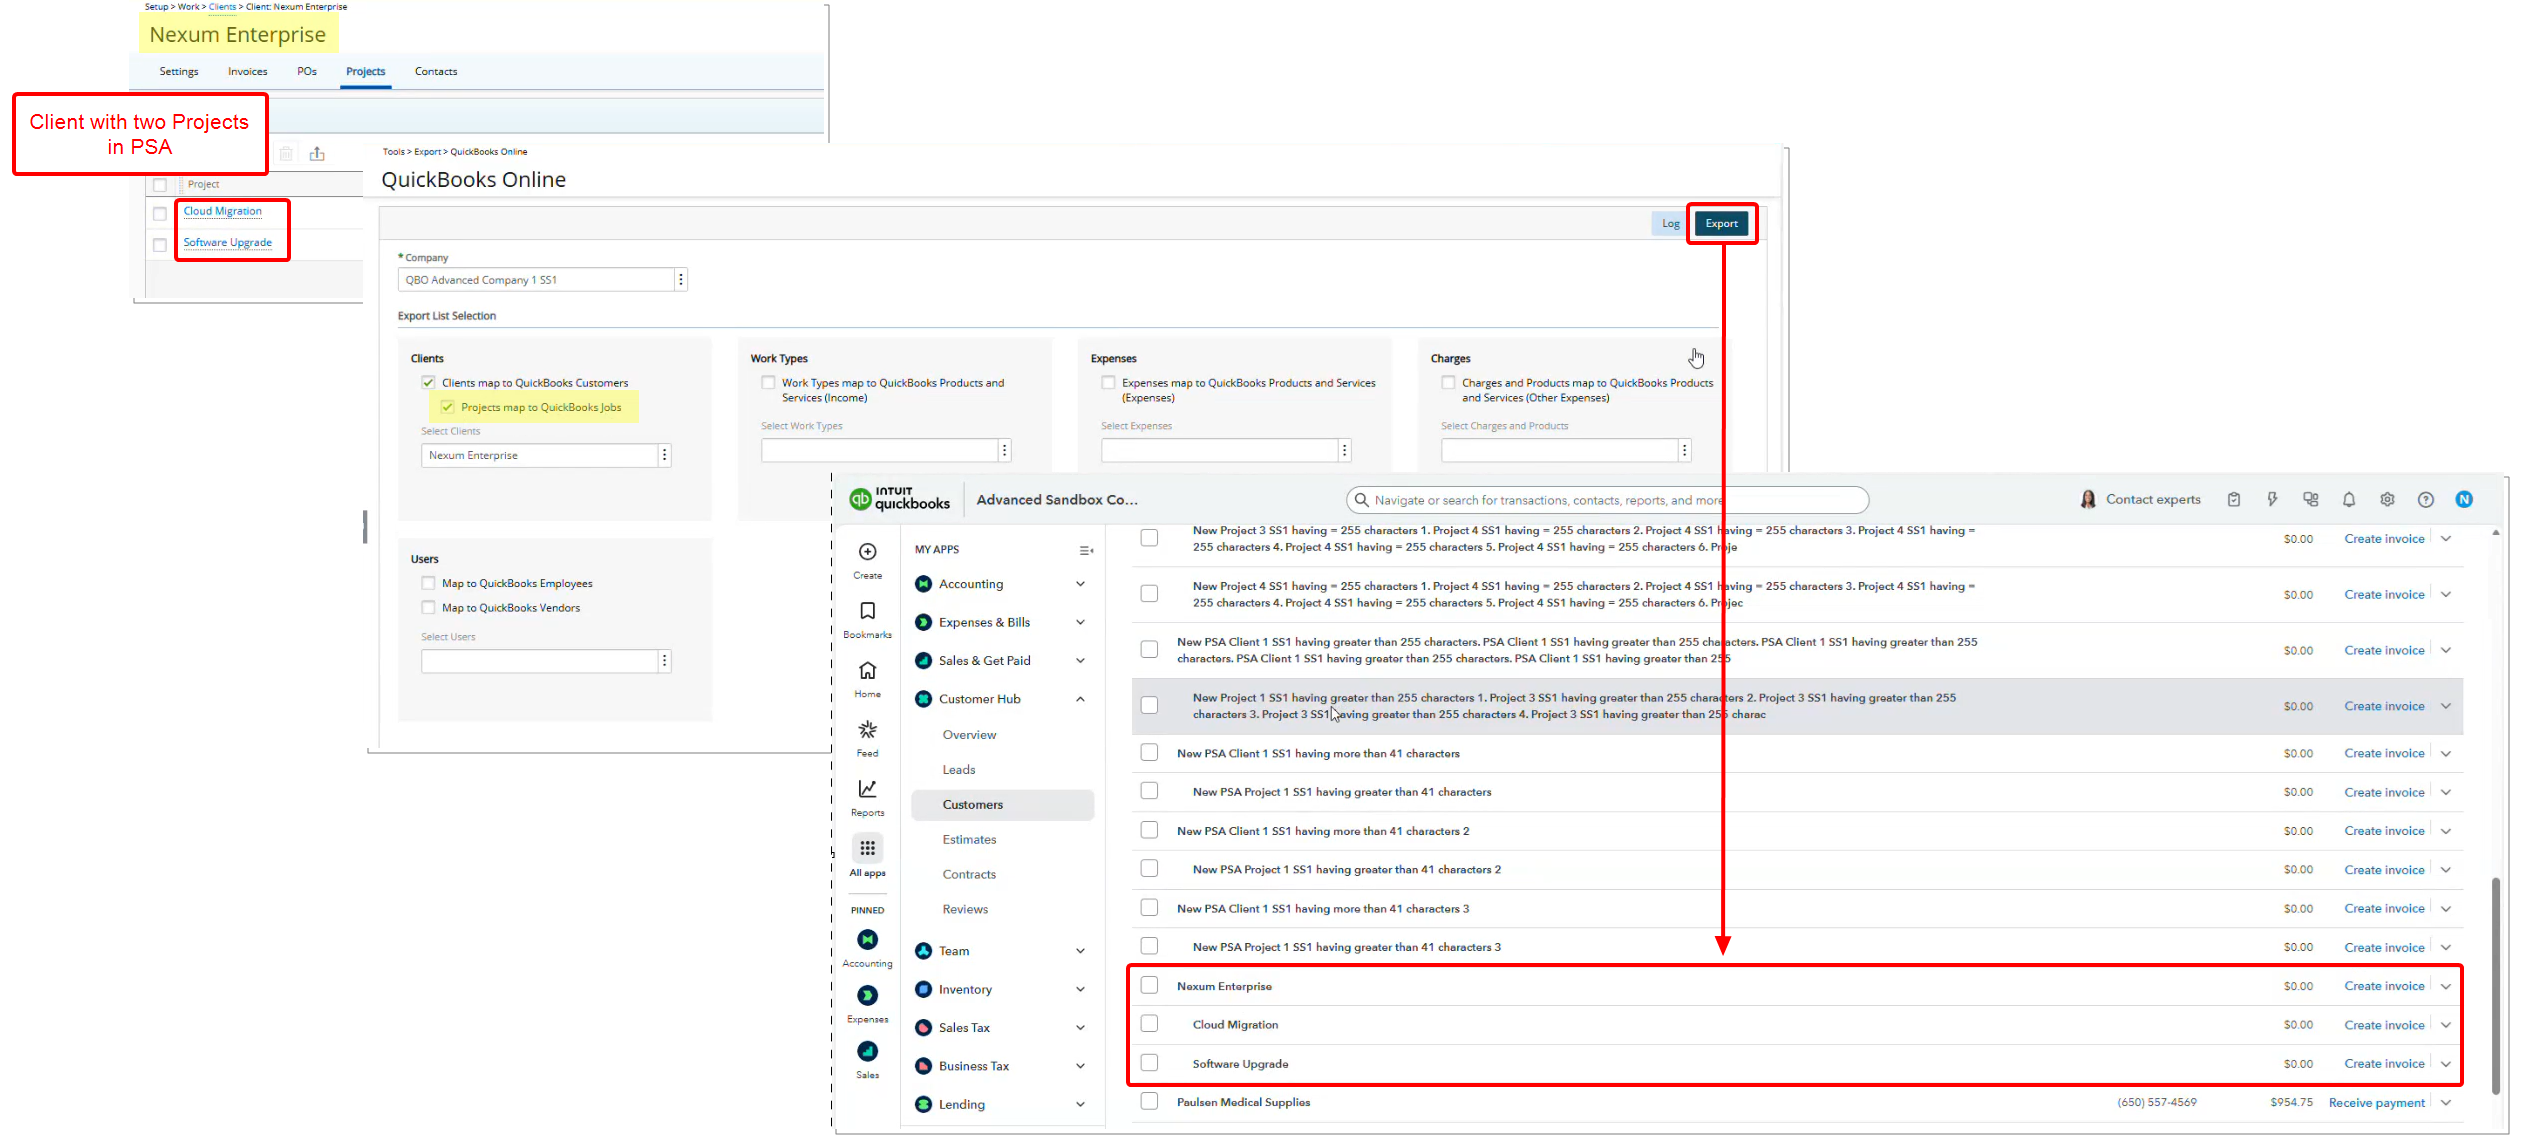
Description: Previously, users could export Clients to QuickBooks Online but could not export individual Projects as Jobs. This limitation required manual creation of Jobs in QuickBooks Online for each Project, leading to increased administrative effort and risk of inconsistencies between PSA and QuickBooks Online.
This release introduces a new option, Projects map to QuickBooks Jobs, within QuickBooks Online Export page (Tools > Export > QuickBooks Online). When enabled, PSA Projects are exported directly as Jobs.
Prerequisite: The Jobs map to Upland PSA Projects option must be enabled at the Accounting System level (Setup > Financial > System > Accounting) for the Projects map to QuickBooks Jobs option to become available. If this setting is not enabled, the new option will remain disabled and unchecked.
Key aspects of this enhancement include:
- Projects without an existing Integration ID are automatically created in QuickBooks Online, while projects with existing Integration IDs are selectively updated based on the comparison of Last Exported Date and Last Updated Date, preventing unnecessary overwrites.
- Exported project data maps Project Name to Job Name and Client to Customer Name in QuickBooks Online, maintaining a clear hierarchy and accurate association between projects and their parent clients.
- Subsequent updates in PSA, such as changes to project details or client assignments, are reflected during the next export, ensuring consistent data across systems.
Benefit: This enhancement reduces manual effort, ensures data consistency, and streamlines the workflow for users managing projects across PSA and QuickBooks Online. By automating the creation and update of Jobs in QuickBooks Online directly from PSA, users can maintain accurate financial and project tracking with minimal administrative overhead.
For further details see PSA - QuickBooks Online Integration
Project Team
Description: In the previous release, the Project Team page did not consistently display Forecasted Billing Rates or Cost Rates for team members or Roles for Projects with future Start dates, or for Users with future Onboarding or past Offboarding dates. This created visibility gaps for project managers when planning and staffing projects.
This release improves rate visibility by aligning displayed rates with Onboarding, Offboarding, and Project dates.
User Rates
| Condition | Rate Displayed |
|---|---|
| Onboarding date is in the future | Rate defined on Onboarding date (if any*) |
| Today is between Onboarding and Offboarding dates | Today’s rate |
| Offboarding date is in the past | Rate defined on Offboarding date (if any*) |
Note: * If no Rate is defined on the applicable Onboarding or Offboarding date, no Rate is displayed. This indicates that rate information is missing and may require review or configuration to support accurate planning, forecasting, or reporting.
Role Rates
| Condition | Rate Displayed |
|---|---|
| Project Start date is in the future | Rate defined on Project Start date (if any**) |
| Today is between project Start and End dates | Today’s rate |
| Project End date is in the past | Rate defined on Project End date (if any**) |
Note: ** If no rate is defined on the applicable Project Start or End date, no Rate is displayed. This serves as a signal that role rate configuration may be incomplete and should be reviewed to ensure accurate project cost and billing.
Benefit: This improvement provides clear and accurate visibility into team members’ roles and rates, including for future projects and users with upcoming or past onboarding or offboarding dates. When a rate is not displayed, it clearly indicates that rate information is not defined for the applicable date, prompting review as needed. By ensuring relevant rates are visible at the right time, this update streamlines project planning, improves resource allocation, and reduces manual verification, enabling faster and more confident decision-making.
For further details see Understanding Forecasted Billing and Cost Rates on the Project Team Page.
Resource Management
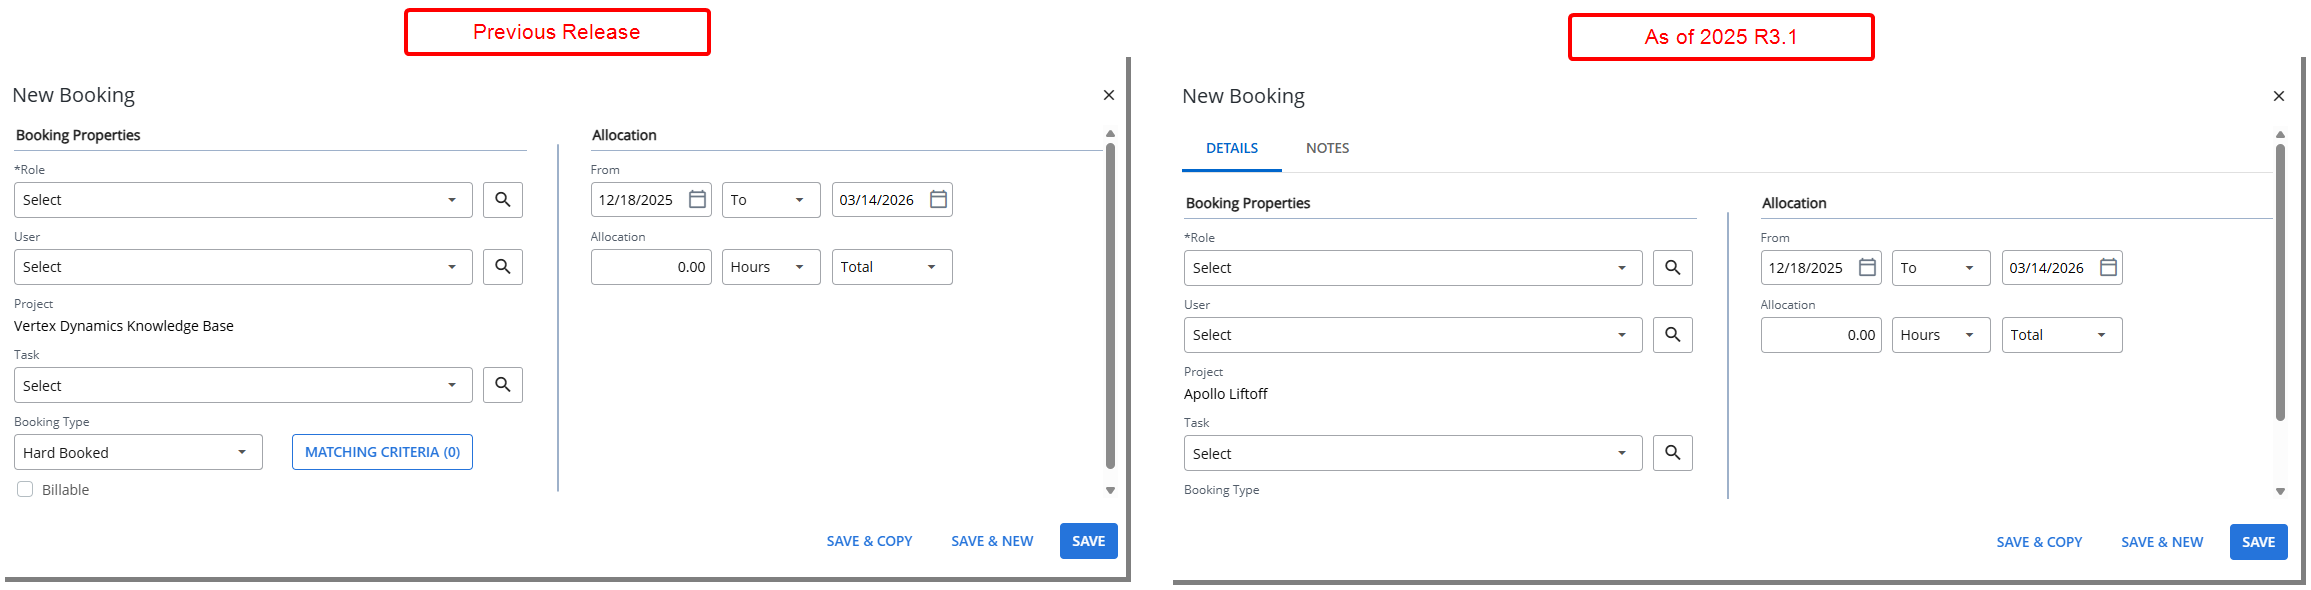
Description: In the previous release, Resource Managers could not create Notes during the process of creating a New Booking. Notes had to be added only after the booking was saved, requiring extra steps and time.
With this release, a Notes tab has been added to the New Booking dialog box, allowing Resource Managers to add a Note prior to saving a new Booking.
To Add a Note:
- From the Work Plan, click New and select Booking.
- Complete the required booking fields (Role, User, Project, Task, Booking Type, etc.).
- Navigate to the Notes tab.
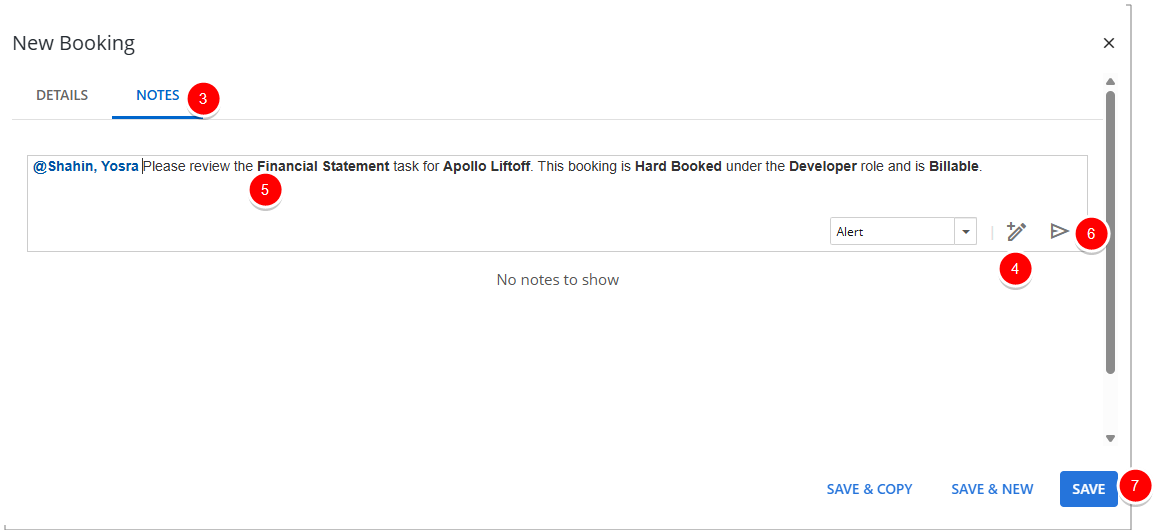
- Click the Show Formatting Options
 button to access the Rich Text editor to format your Note.
 - Enter the required note in the text field and format it as needed using the available options in the Rich Text Editor.
Note: If Enable Mentioning in Comments & Notes is turned on in System Configuration, you can mention team members using @ notation. A placeholder message—“Type @ to mention and to notify someone”—appears next to the cursor as guidance.
- Click Send
 to save the note and send notifications to mentioned users. You can add additional notes by repeating steps 5 and 6 as needed, or edit or delete a saved note.
 - Click Save to save the booking and close the New Booking dialog box.
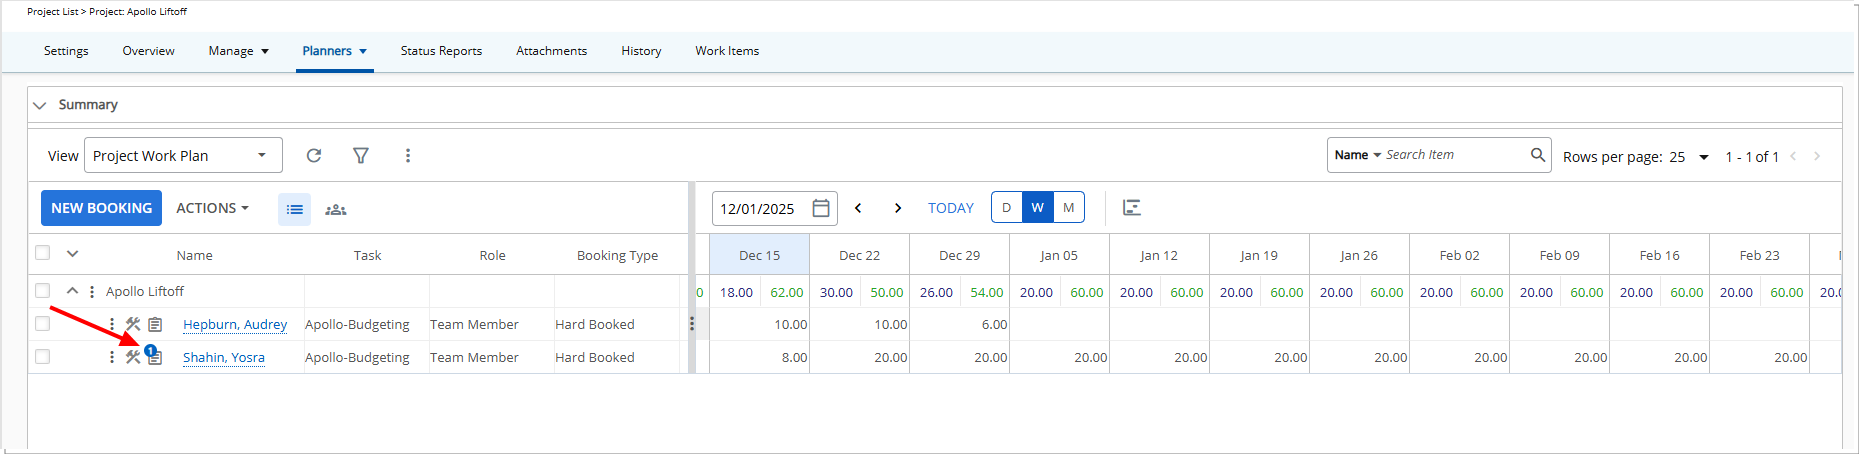
- When the Work Plan refreshes, you will see your new booking line with a counter on the Note icon, indicating that your note has been saved.
Benefit: This enhancement allows Resource Managers to add notes directly while creating a new booking, eliminating the extra step of adding notes afterward. By capturing notes immediately and optionally mentioning team members, you can save time, improve communication, and ensure all relevant information is documented with the booking from the start.
For further details see:
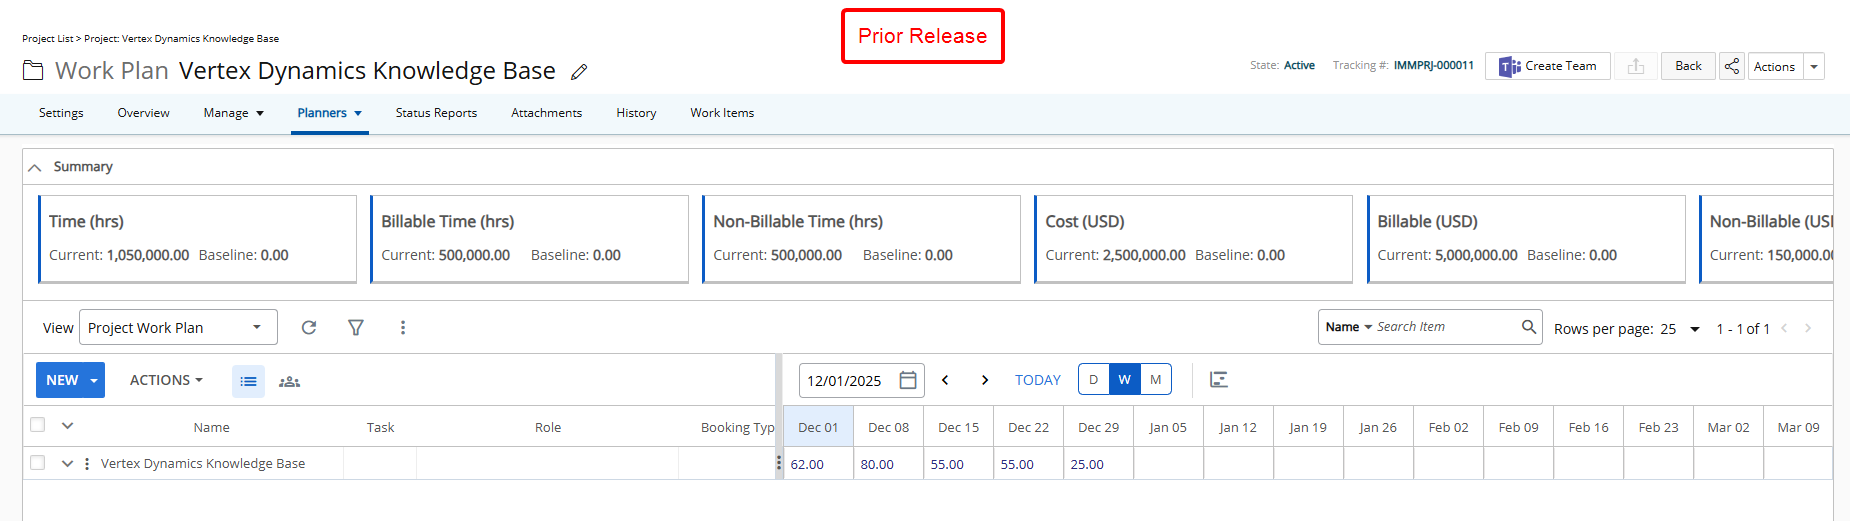
Description: In earlier releases, the Summary Section displayed five Key Performance Indicators (KPIs). Users were required to scroll in order to access the remaining metrics, which reduced efficiency and made it difficult to get a quick, comprehensive overview of project and resource performance.
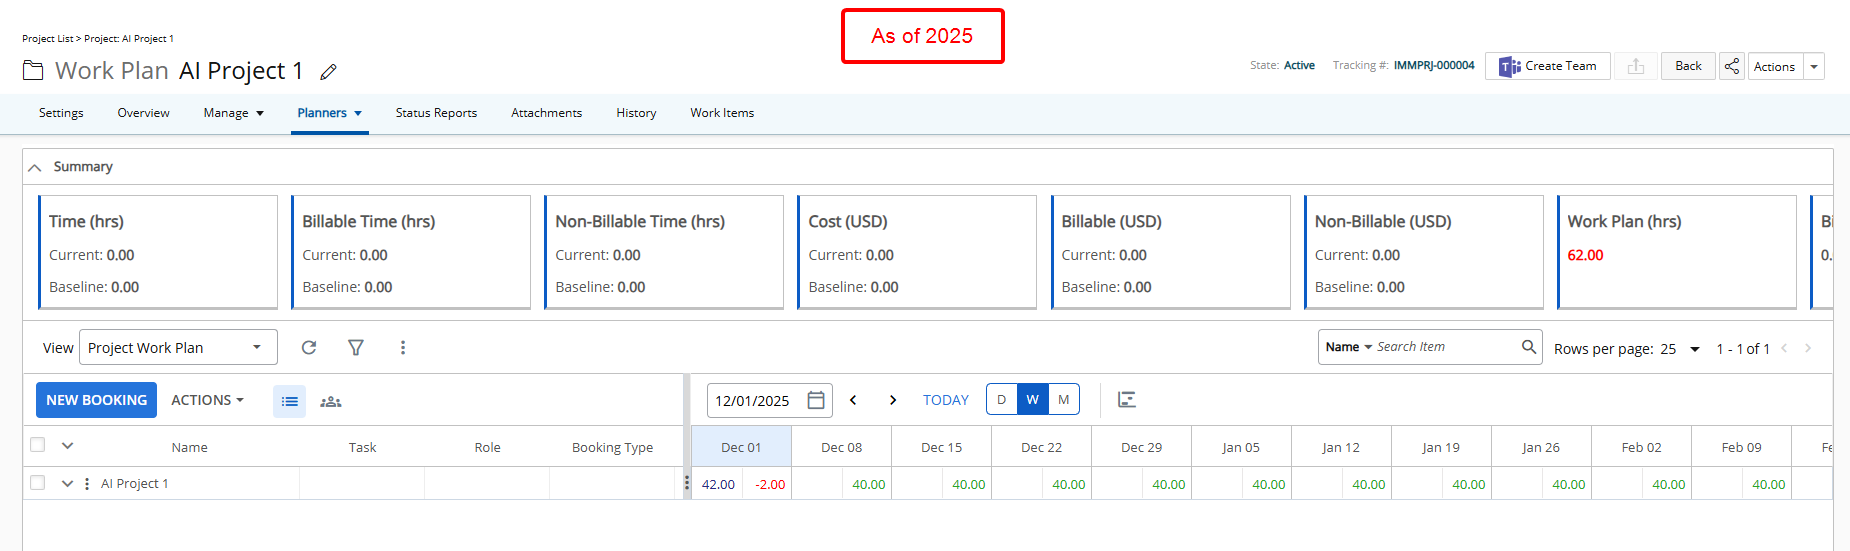
This release introduces a layout adjustment that increases the number of KPIs visible in the Summary Section by default. Approximately seven KPIs can now be seen on the screen at the recommended resolution (1920 x 1080). You can still scroll to view additional KPIs if the total exceeds the visible area.
All numeric fields, including hours and currency, are displayed in decimal format to maintain consistency.
Benefit: The enhancement improves usability by reducing the need to scroll, allowing users to access a broader set of performance metrics at a glance. This supports faster decision-making, provides a more complete snapshot of performance in a single view.
For further details see Enable the Summary Section on the Project Work Plan.
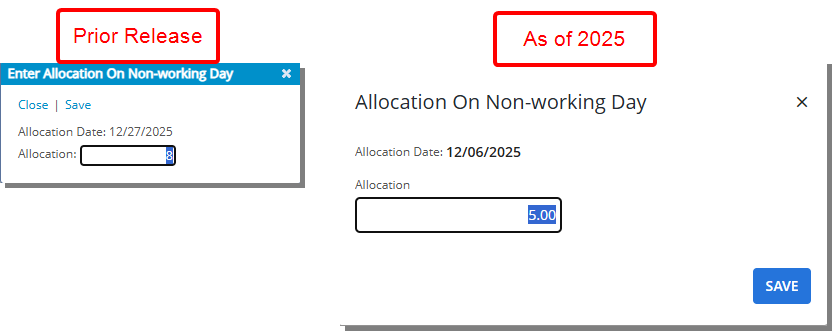
Description: In this release, the Allocation On Non-Working Day dialog box has been redesigned to align with the modern Upland visual style. The refreshed interface features cleaner spacing, improved alignment, and clearer typography visually organized and easier to understand at a glance.
Benefit: The modernized design and the consistent look and feel across dialog boxes help you navigate with confidence. These changes improve efficiency and create a smoother, more intuitive experience in Resource Management.
For further details see Book on Non-Working Days in Chart View.
Description: In previous releases, users of Resource Management were required to specify the exact Allocation dates when Shifting bookings. Attempting to Shift Bookings outside these exact dates caused errors, preventing multiple bookings from being adjusted simultaneously. This made it difficult for project managers to respond quickly to changes in project schedules.
As of this release, the exact allocation date validation has been removed when shifting bookings. Users can now shift one or multiple bookings without being forced to specify the exact Start and End dates of each allocation. The system will automatically determine the minimum and maximum applicable dates for each booking and apply the shift correctly. Validations related to the overall Project, Task, User, and Resource dates remain intact to prevent scheduling outside allowable boundaries.
Scenarios and Examples
- Multiple Bookings with Open Dates: Users can select multiple bookings starting on different dates and shift them together without encountering errors.
- Shifting Outside Earliest or Latest Booking: A booking with allocation dates from Dec 8–10 can now be shifted starting from Dec 5 without error; the system applies only the relevant booking dates.
- Validation Preserved: Attempts to shift outside the hiring dates, project start/end dates, or task boundaries are still prevented.
Example: A user selects three bookings for a project with varying Start dates. Previously, shifting these together would fail if the shift dates did not exactly match the earliest and latest booking. With this update, the user can define any shift period within project constraints, and the system automatically applies the correct dates for each booking.
Benefits:
- Faster Adjustments: Shift multiple bookings at once without gathering exact allocation details.
- Reduced Errors: Eliminates unnecessary error messages while maintaining critical project and resource constraints.
- Improved Flexibility: Users can quickly respond to changes in project schedules without manual rework.
For further details see Shift a Booking.